

What’s on the Home page
On the Home page, you find dashboards created for you, which you can use as they are, and your own dashboards. You can create a dashboard from scratch or copy one that someone else created and edit your copy.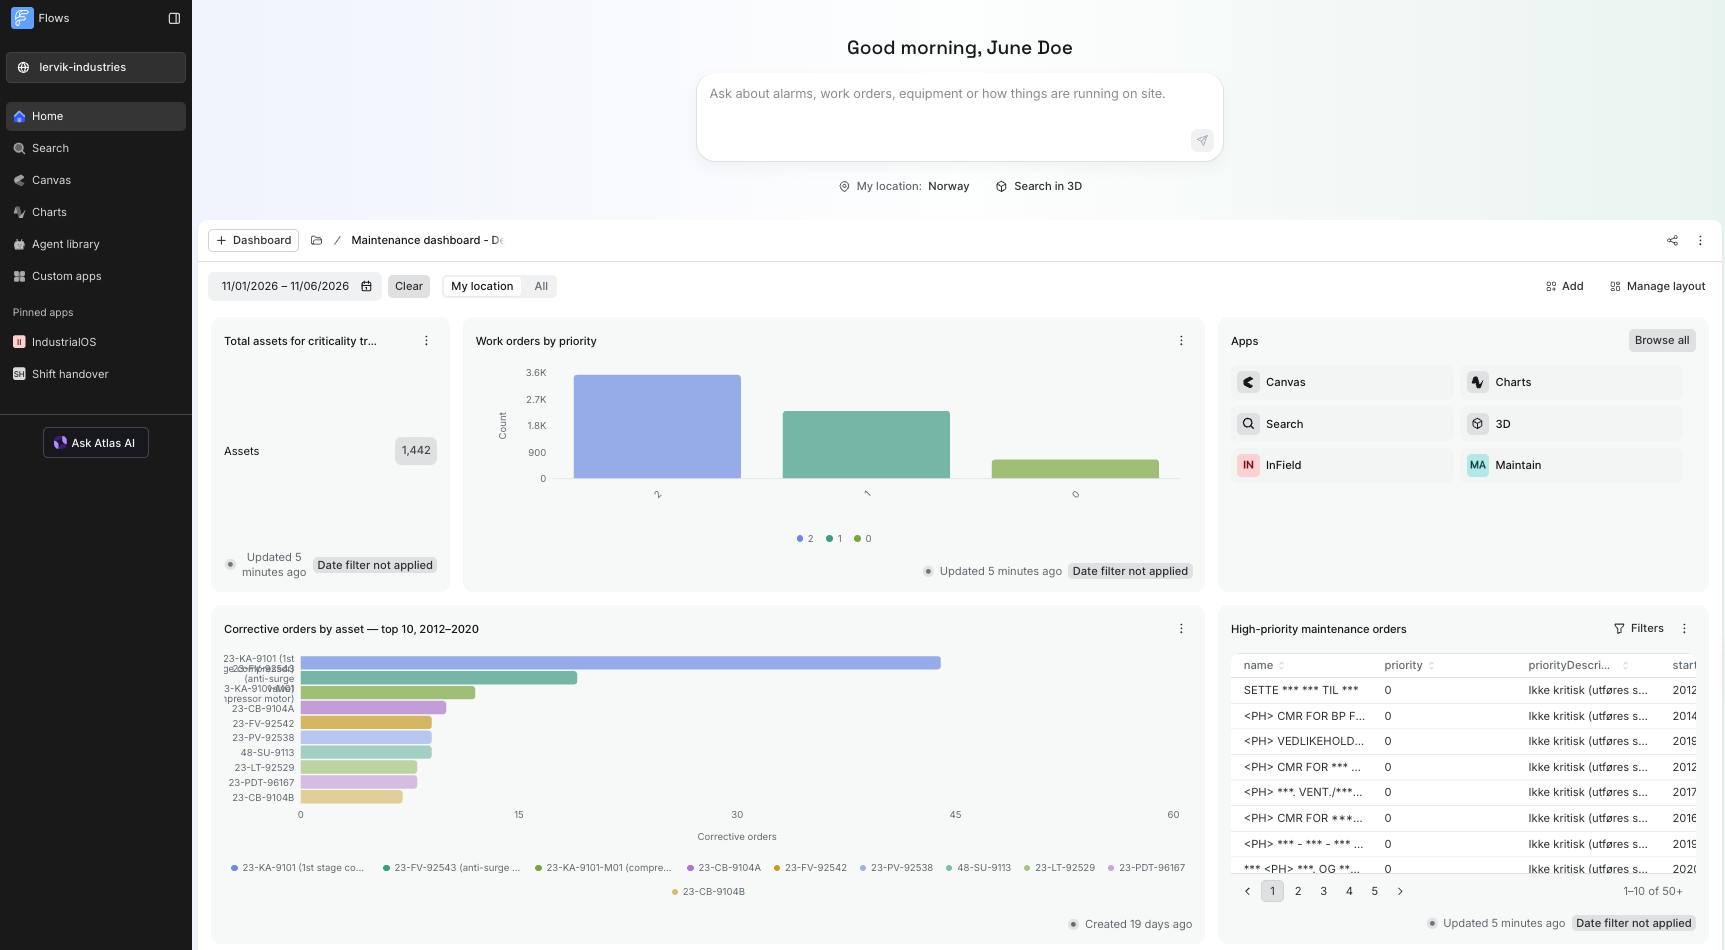
- For everyone
- With Atlas AI
- Search, to find your data.
- Dashboards, created for you or by you.
- Widgets, such as data visualizations, Flows custom apps, an app launcher, and your recent activity. See Build a dashboard.
- Sharing, to let colleagues or everyone in your organization view a dashboard and copy it as a starting point for their own.
- Mobile access, to open the Flows workspace and your dashboards on a mobile device.
Search or ask Atlas AI
Use the box at the top of the Home page to search and analyze data yourself, or ask Atlas AI:- Search. Enter an asset ID, file name, or keyword, and press Enter to open the results in Search. From there, you can filter, preview, and explore your data.
- Ask Atlas. Ask a question or describe what you need, then select Ask Atlas. Atlas AI can answer your question, start an investigation, or create widgets for you when you ask it to.
Dashboards
A dashboard is a set of widgets arranged on one page. Instead of rebuilding the same view every time you need it, you arrange the widgets for a role or task once, and the data and apps are ready whenever you open the Home page. You can share dashboards with colleagues and teams.Example dashboards
These examples show what different roles can use a dashboard for and which widgets they add to it:- Shift supervisor. To start each shift with a handover summary and continue earlier work where they left off, a shift supervisor adds a Smart widget that summarizes the last shift, a gauge for key process values, and a Recent activity widget. The Smart widget requires Atlas AI.
- Reliability engineer. To compare equipment trends with open issues on the same page, a reliability engineer adds line charts of key equipment trends, a table of open issues, and an app launcher to open Canvas and investigate further.
- Operations manager. To review the same numbers with the team in meetings, an operations manager adds KPI cards and area charts for the site and shares the dashboard with the whole team.
Explore existing dashboards
Browse the dashboards available to you, including dashboards that others have shared with you. To create your own version that you can edit, copy a dashboard. To keep a dashboard within reach, pin it to your tab bar.Build a dashboard
Your first dashboard is created together with your first widget. To create it, do one of the following:- Select Create with Atlas. In the dialog that opens, describe the goal of the widget, and Atlas AI creates it for you.
- Select Create widget, and then select a widget type.
- Visualization. Select a table, vertical bar chart, line chart, area chart, pie chart, gauge, or KPI card.
- Flows custom app. Select Flows app, and then select the Flows custom app you want to embed on the dashboard as a live widget.
-
App launcher. Add one widget that opens all the apps you use. The widget can include:
- Apps, such as Canvas, Charts, Search, and 3D. These are included by default.
- Your organization’s Flows custom apps.
- Links to other apps you use, for example, Cognite InField and Cognite Maintain, and other apps that aren’t part of CDF.
- Recent activity. Show your recent searches, canvases, and charts. With Atlas AI, it also shows your recent conversations. Select an item to continue where you left off.
- Ask Atlas. Open a chat with Atlas AI, describe what you want to see, and work out the widget together in the conversation.
- Smart widget. Enter a question or task for Atlas AI to track, for example, Provide a handover summary from the last shift. Atlas AI fetches the data and shows the answer in the widget, using the dashboard’s current date range and location filters. From the widget, you can refresh the answer with the latest data or explore it further with Atlas AI.
Manage and share dashboards
Use the controls in the upper-right corner of a dashboard to change the dashboard and share it with others.Manage a dashboard
On a dashboard you created or copied, you can:- Select Add to add widgets.
- Select Manage layout to move widgets around and resize them.
- Open the options menu to edit, import, export, duplicate, or delete the dashboard, or to set it as your default.
Share a dashboard
To share the dashboard, select the share icon next to the options menu, and then do one of the following: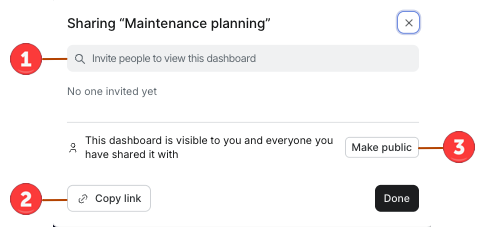
Requirements
The Home page works with CDF projects that store data in the core data model, the process industries data model, or extensions of these data models. Your CDF admin should also set up location filters for the project:- Configure location filters to divide the project’s data into meaningful areas, such as plants or production units.
- Give every user access to at least one location filter that uses the core data model, the process industries data model, or an extension of these data models.