

Before you begin
- Make sure an administrator has set up the data source and turned on the Records tab.
Listing records
Use the List query type to return each record as a row, for example, to show the latest alarms in a table panel. Each column you select becomes a field in the result.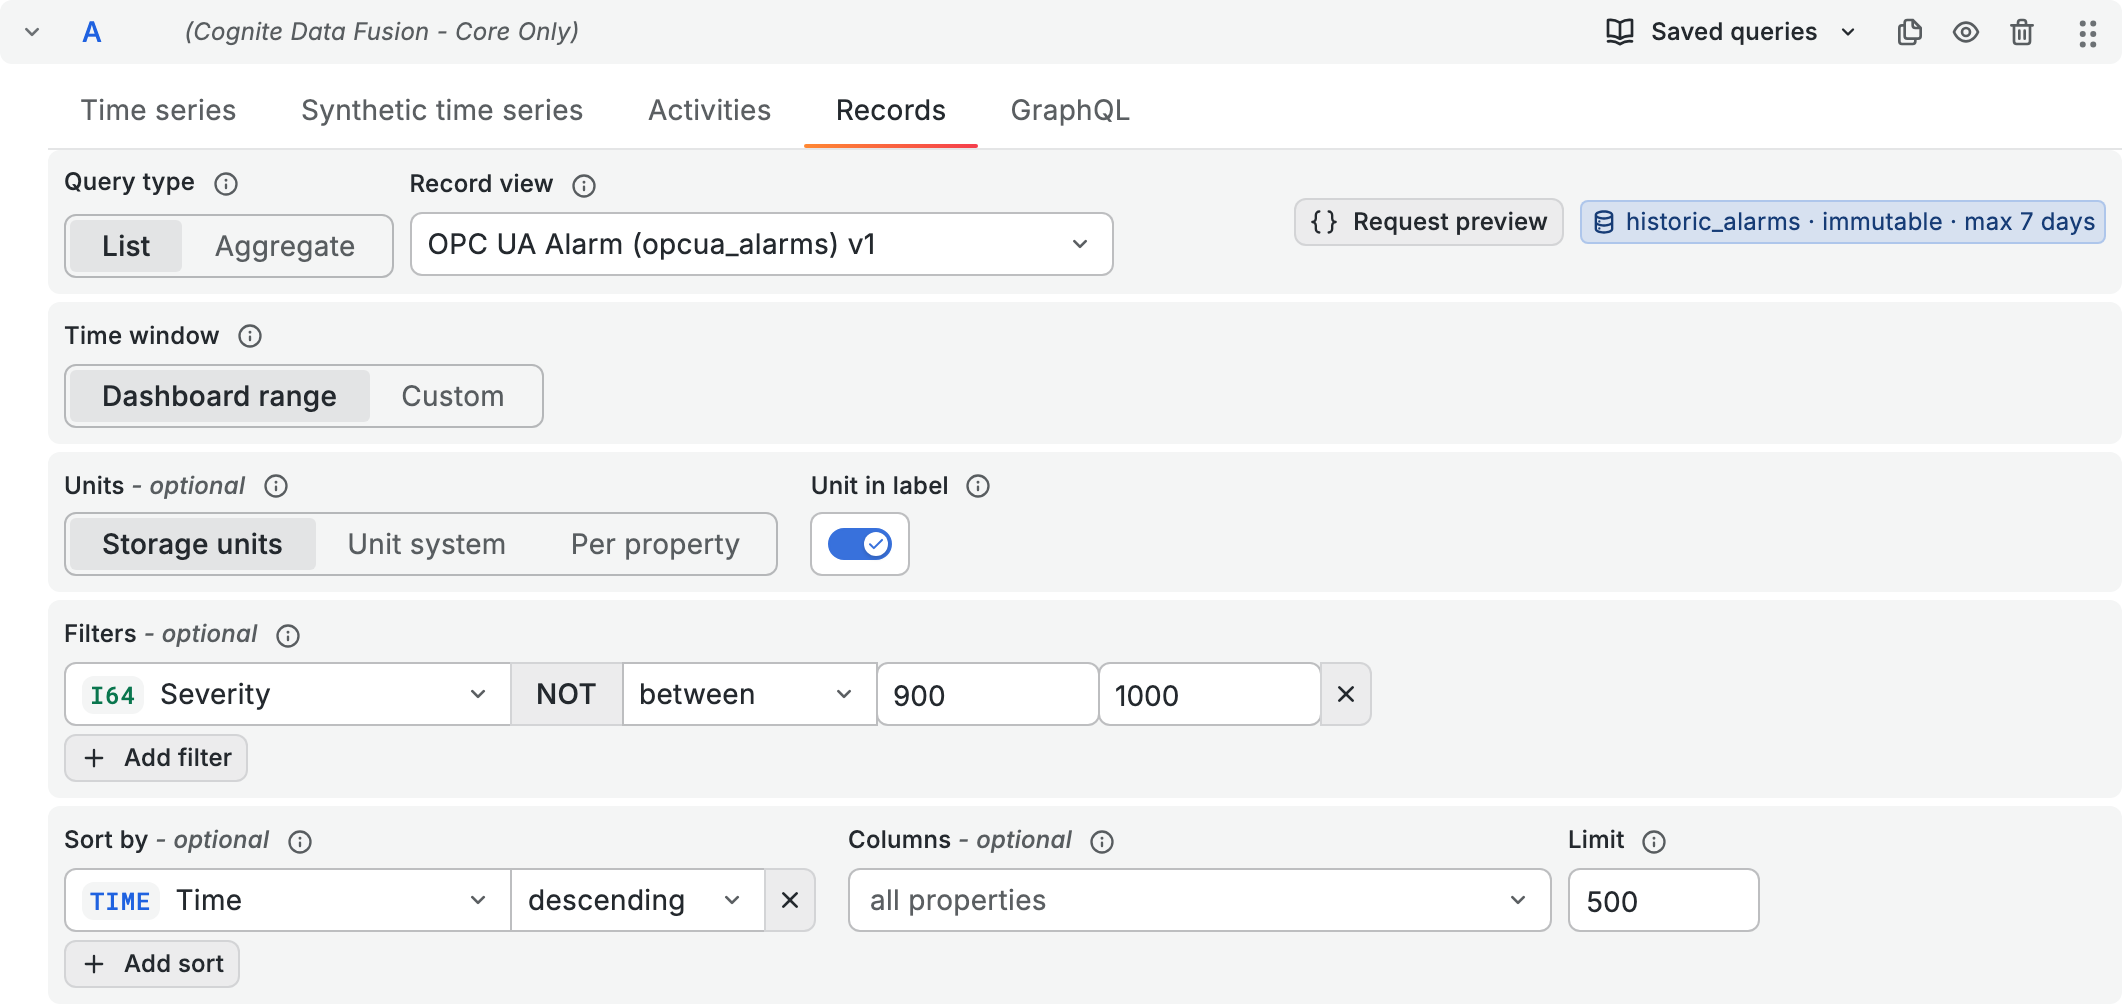
1
Select a record view
On the Records tab, set Query type to List and select a Record view. The dropdown lists record views with their space and version, and the stream each view reads from.After you select a view, a badge shows the stream, its type, and its maximum filtering interval.
2
Set the time window
In the Time window field, choose which records to read, by their last updated time. See Choosing a time window.
3
Add filters
Optionally, select Add filter to match records on any property of the view, or on the record properties
space, externalId, createdTime, and lastUpdatedTime. See Filtering records.4
Choose columns, sorting, and limit
- Columns - the properties to show. Leave it empty to show every view property and the record properties.
- Sort by - up to five properties to sort by, ascending or descending.
- Limit - the maximum number of records to return, from 1 to 1000. The default is 1000.
The panel shows one row for each record that matches the time window and filters, with the columns you selected.
Aggregating records
Use the Aggregate query type to compute statistics in CDF instead of returning rows, for example, to plot the number of alarms per hour for each site.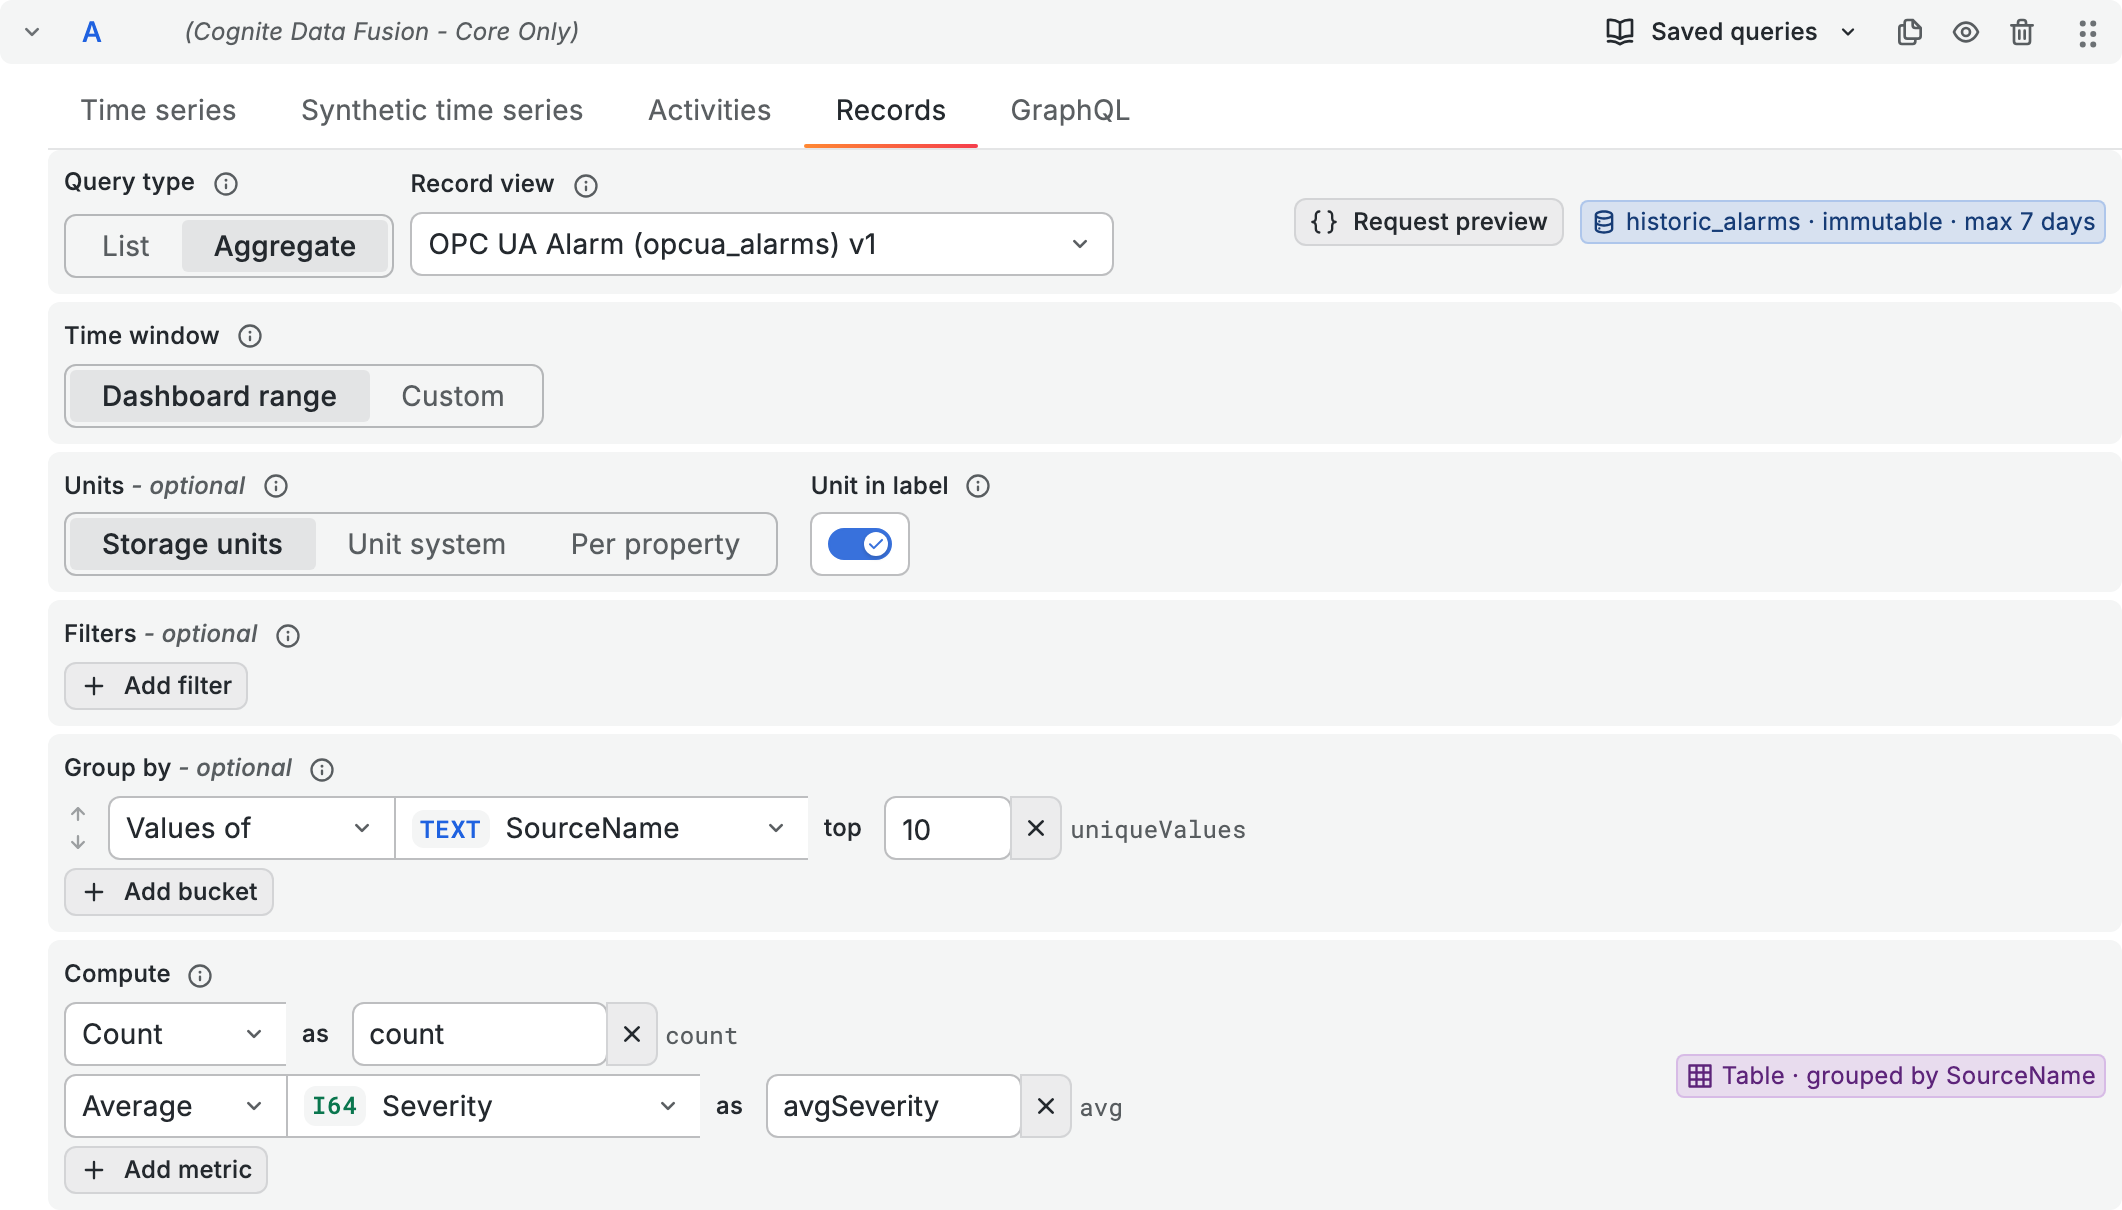
1
Select Aggregate
Set Query type to Aggregate, select a Record view, and set the Time window.
2
Group the records
Optionally, select Add bucket under Group by. You can add up to four levels:
- Time bucket groups records into time intervals, from
1sto7d. Choose Auto to size the intervals from the panel width and time range, or Auto · fewer points for about a quarter as many points. - Values of groups records by the unique values of a property. Set how many of the top values to return. The default is 10.
3
Add metrics
Under Compute, select Add metric. You can add up to five metrics. Each metric uses one of the functions Count, Average, Min, Max, or Sum on a property, and becomes one column in the result.
To learn more about aggregating records, see the Records aggregation reference.
Choosing a time window
The Time window field selects records by their last updated time and narrows the stream before the data source applies the filters. Streams limit the time range a single request can cover, and the editor shows a warning if the window is longer than the stream allows. To learn about these limits, see Query time range limits. The table lists the time window options.
With Custom, set the Window bounds with expressions that resolve to a point in time. You can use ISO timestamps, the operators
+ - * /, and the anchors in the table.
For example, set from to
{{endTime}} - {{maxFilteringInterval}} and to to {{endTime}} to read the most recent window the stream allows. If the dashboard range is longer than the maximum filtering interval, add several queries that each read one slice of the dashboard range.
Filtering records
Filters match records inside the time window and are combined with AND. For each filter, select a property and an operator: equals, is any of, between, starts with, exists, contains all, or contains any. Select NOT to invert a filter. Filter values accept dashboard variables. For a direct relation whose view names a target, the filter offers a searchable instance picker. To show only the records of the instances a user selects, filter a direct relation on a variable that holds instance references. Type the variable, for example,$asset, as the filter value:
- Use equals for a single-value variable, and is any of for a multi-value variable.
- For a property that holds a list of direct relations, use contains any or contains all.
Converting units
If a property in the record view declares a unit, the Units field appears. Choose how to convert values:- Storage units - return values in the unit they’re stored in.
- Unit system - convert all unit-aware properties to the units of the unit system you select.
- Per property - select Add conversion to convert individual properties to a target unit.
temperature (°C). Turn off Unit in label to hide it.