

Before you begin
- Make sure an administrator has set up the data source in your Grafana instance.
Creating a dashboard
1
Sign in and create a dashboard
Sign in to your Grafana instance, create a dashboard, and add a visualization. In the Data source field, select your Cognite Data Source.
2
Choose a query tab
Use the query tabs below the chart area to select a data source for your panel.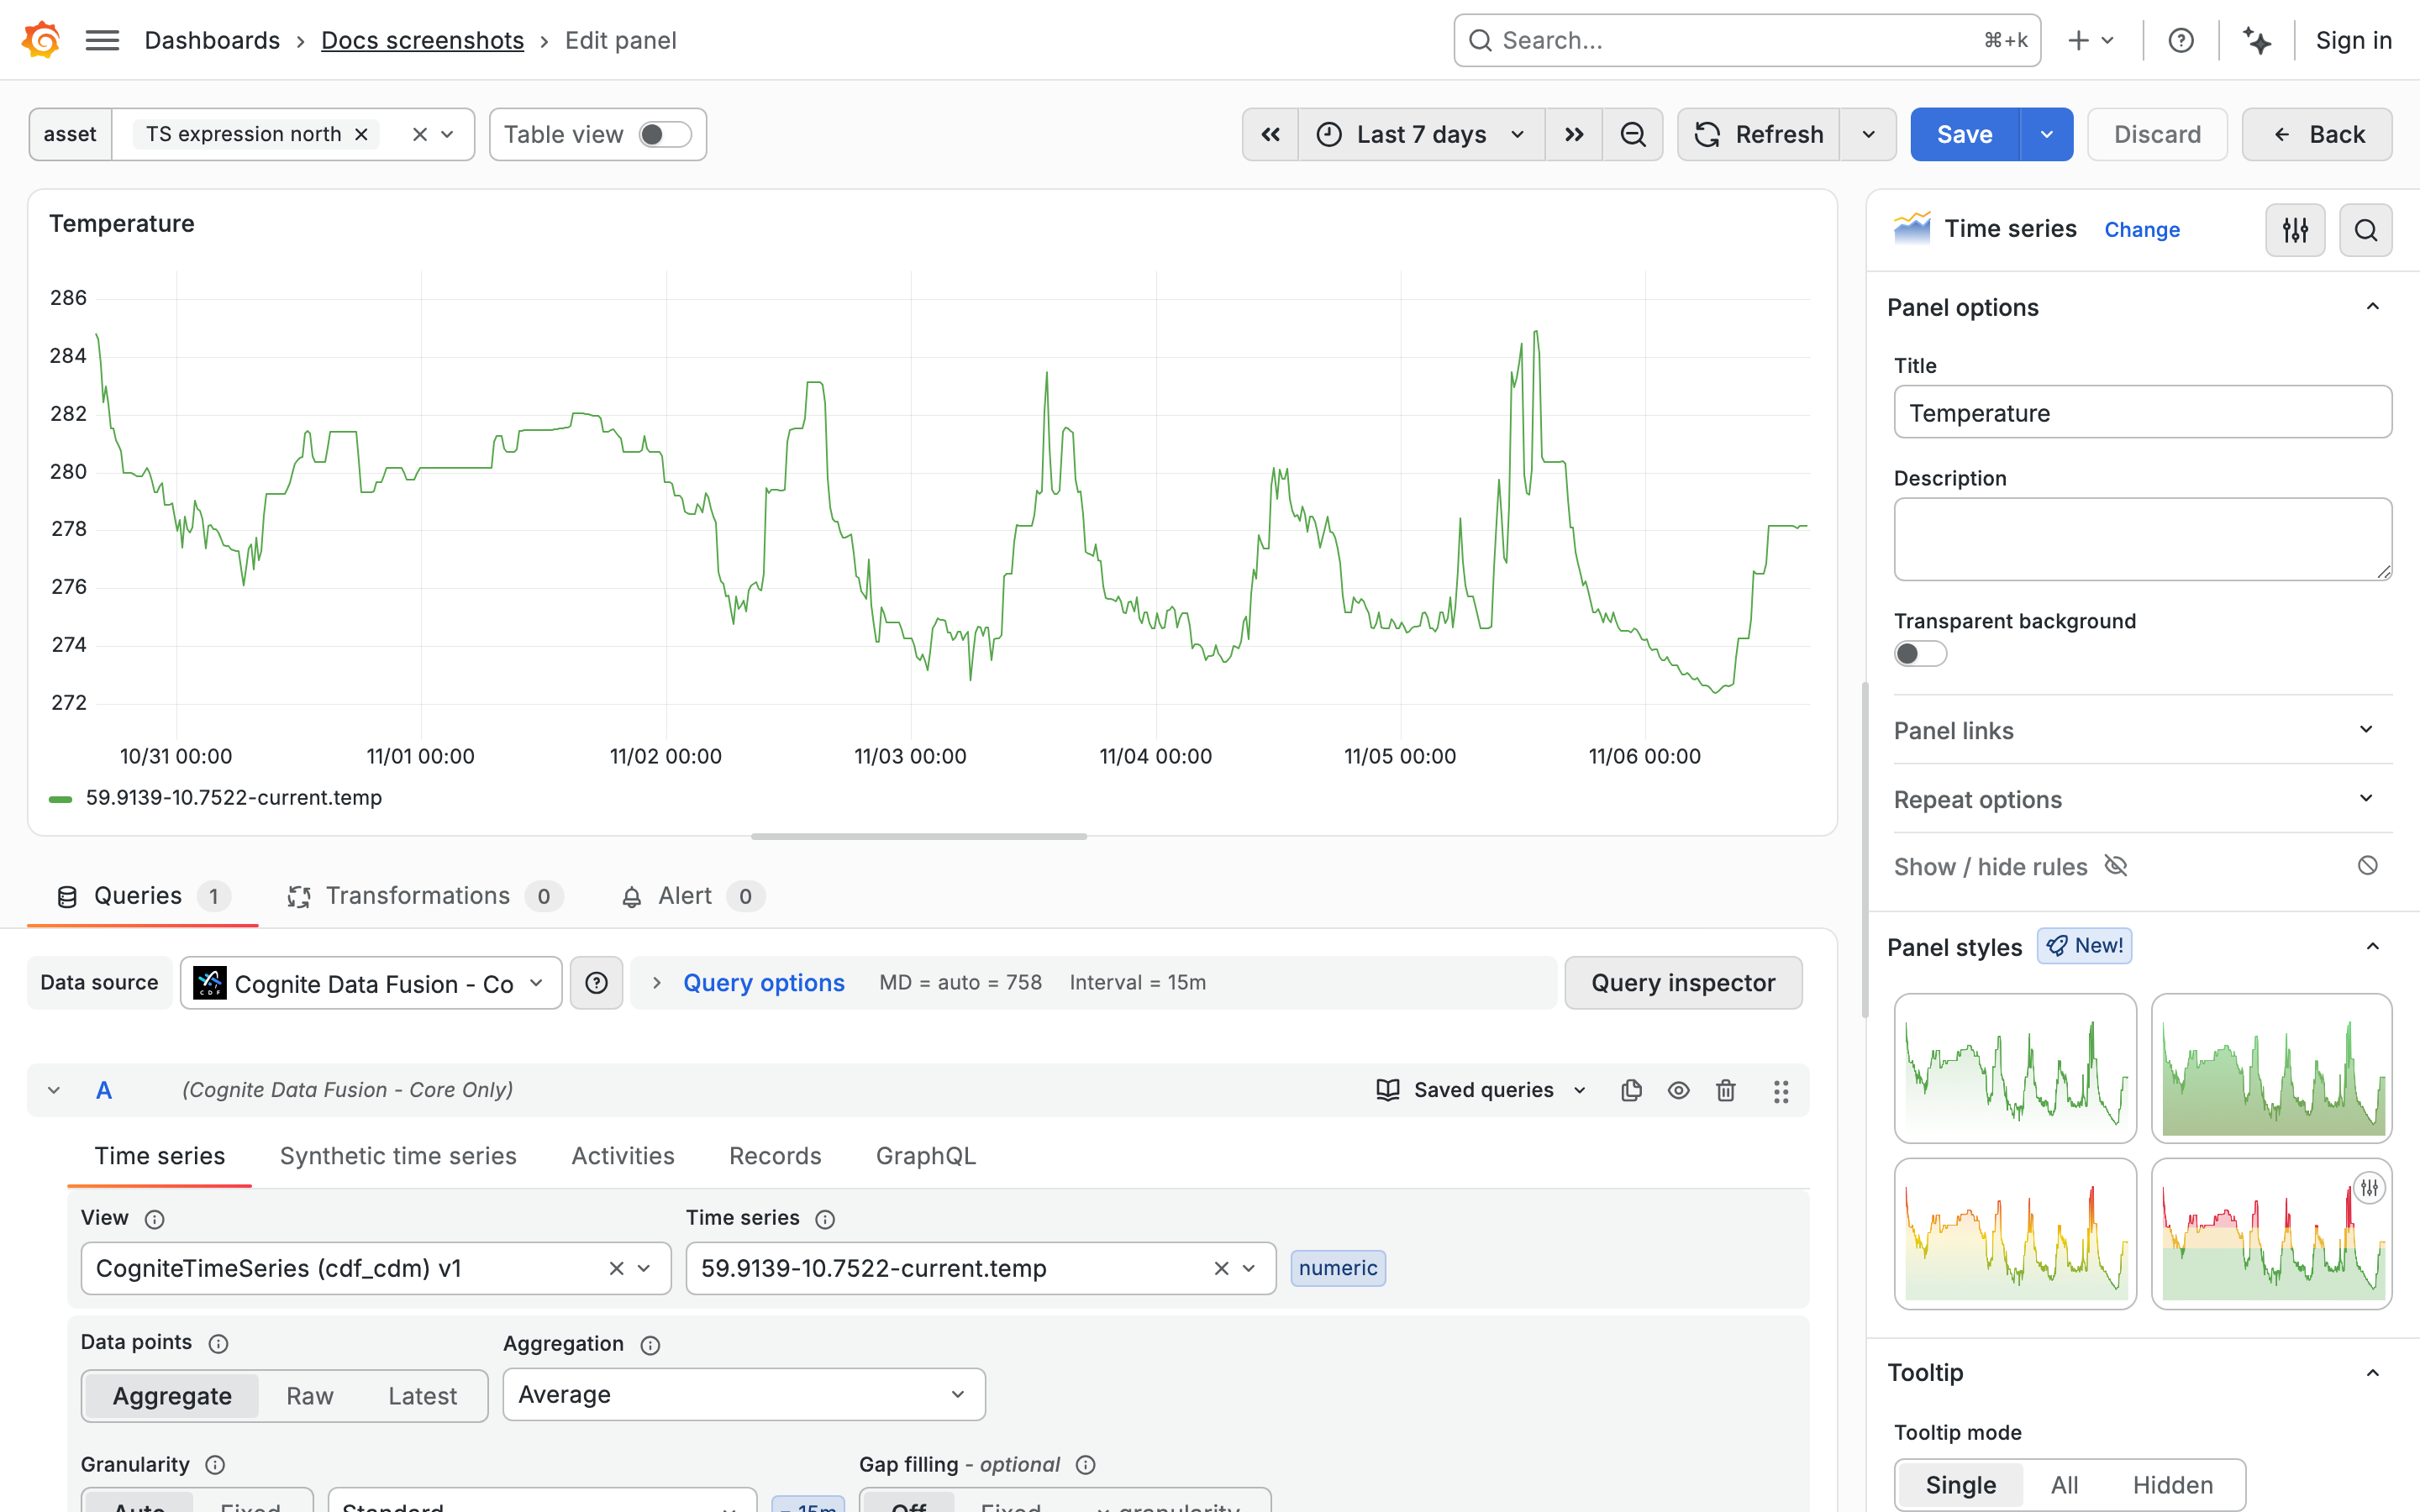
If a tab is missing, see A query tab or variable tab is missing.
3
Set the time range
The panel shows the data in the dashboard time range. Use the time picker above the chart to show the period you’re interested in.
4
Save the dashboard
Give the panel a title and select Save dashboard.
The panel shows data from CDF and updates when you change the time range.