

Before you begin
- Make sure an administrator has set up the data source and turned on the Activities tab.
Showing activities
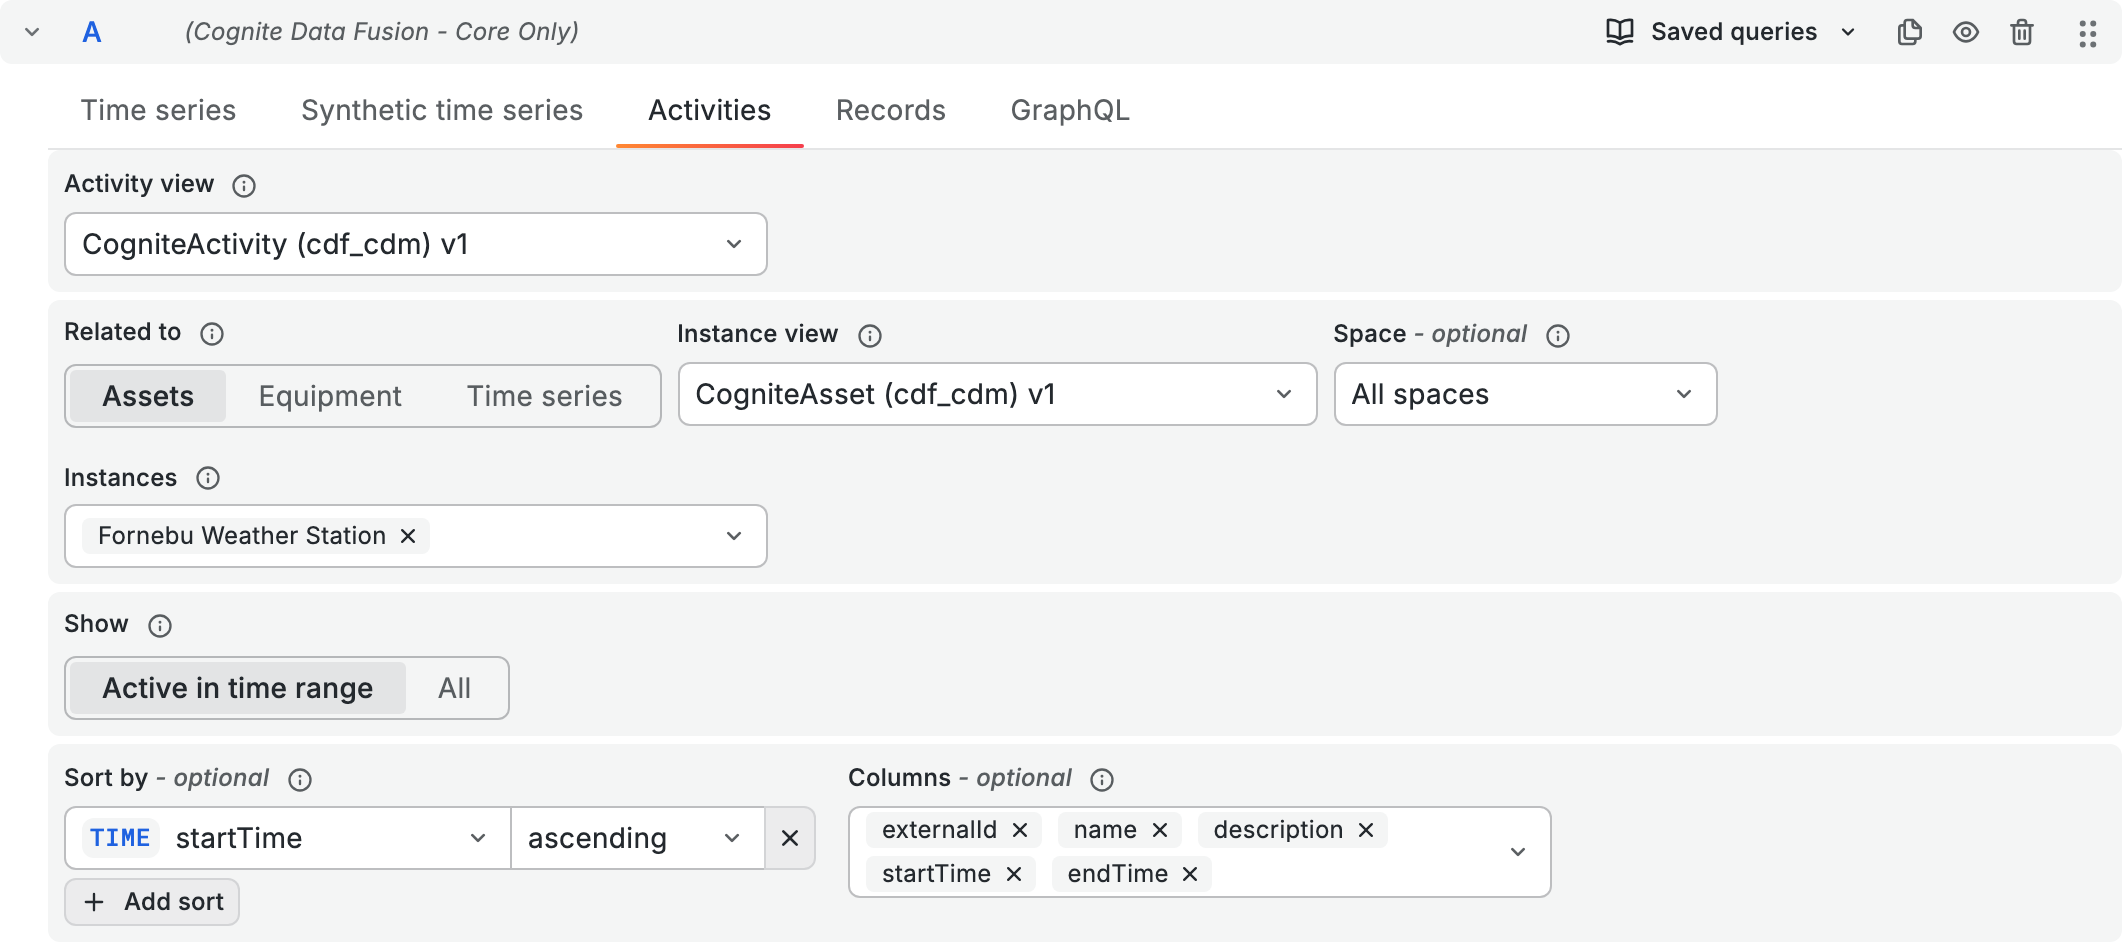
1
Select the activity view
On the Activities tab, select the Activity view to read the activities from.
2
Select the related instances
- Related to - choose the type of instance the activities are related to: Assets, Equipment, or Time series.
- Instance view - select the view to search the instances in.
- Space - optionally, narrow the search to one space. The default is All spaces.
- Instances - search for the instances by name and select the ones whose activities you want to show.
3
Choose which activities to show
In the Show field, choose one of these options:
- Active in time range - the activities that overlap the dashboard time range. This is the default.
- All - every activity related to the instances, whenever it took place.
4
Choose the columns and sorting
- Sort by - the properties to sort the activities by, in order. A new query sorts by
startTime, ascending. - Columns - the properties to show, in order. If you remove all columns, the panel shows every property of the view, then the instance properties
space,externalId,createdTime, andlastUpdatedTime.
The panel shows one row for each activity related to the instances you selected, with the columns you chose.