

- Instances fetches data modeling instances. The panel shows the rows the query returns, for example, a list of assets, equipment, or activities in a table panel.
- Numeric, String, or State fetches data points. The query is a filter that selects the time series to plot, for example, every time series of an asset, and the panel plots the data points of each time series in the result.
Before you begin
- Make sure an administrator has set up the data source and turned on the GraphQL tab.
Running a query
1
Select the data model and version
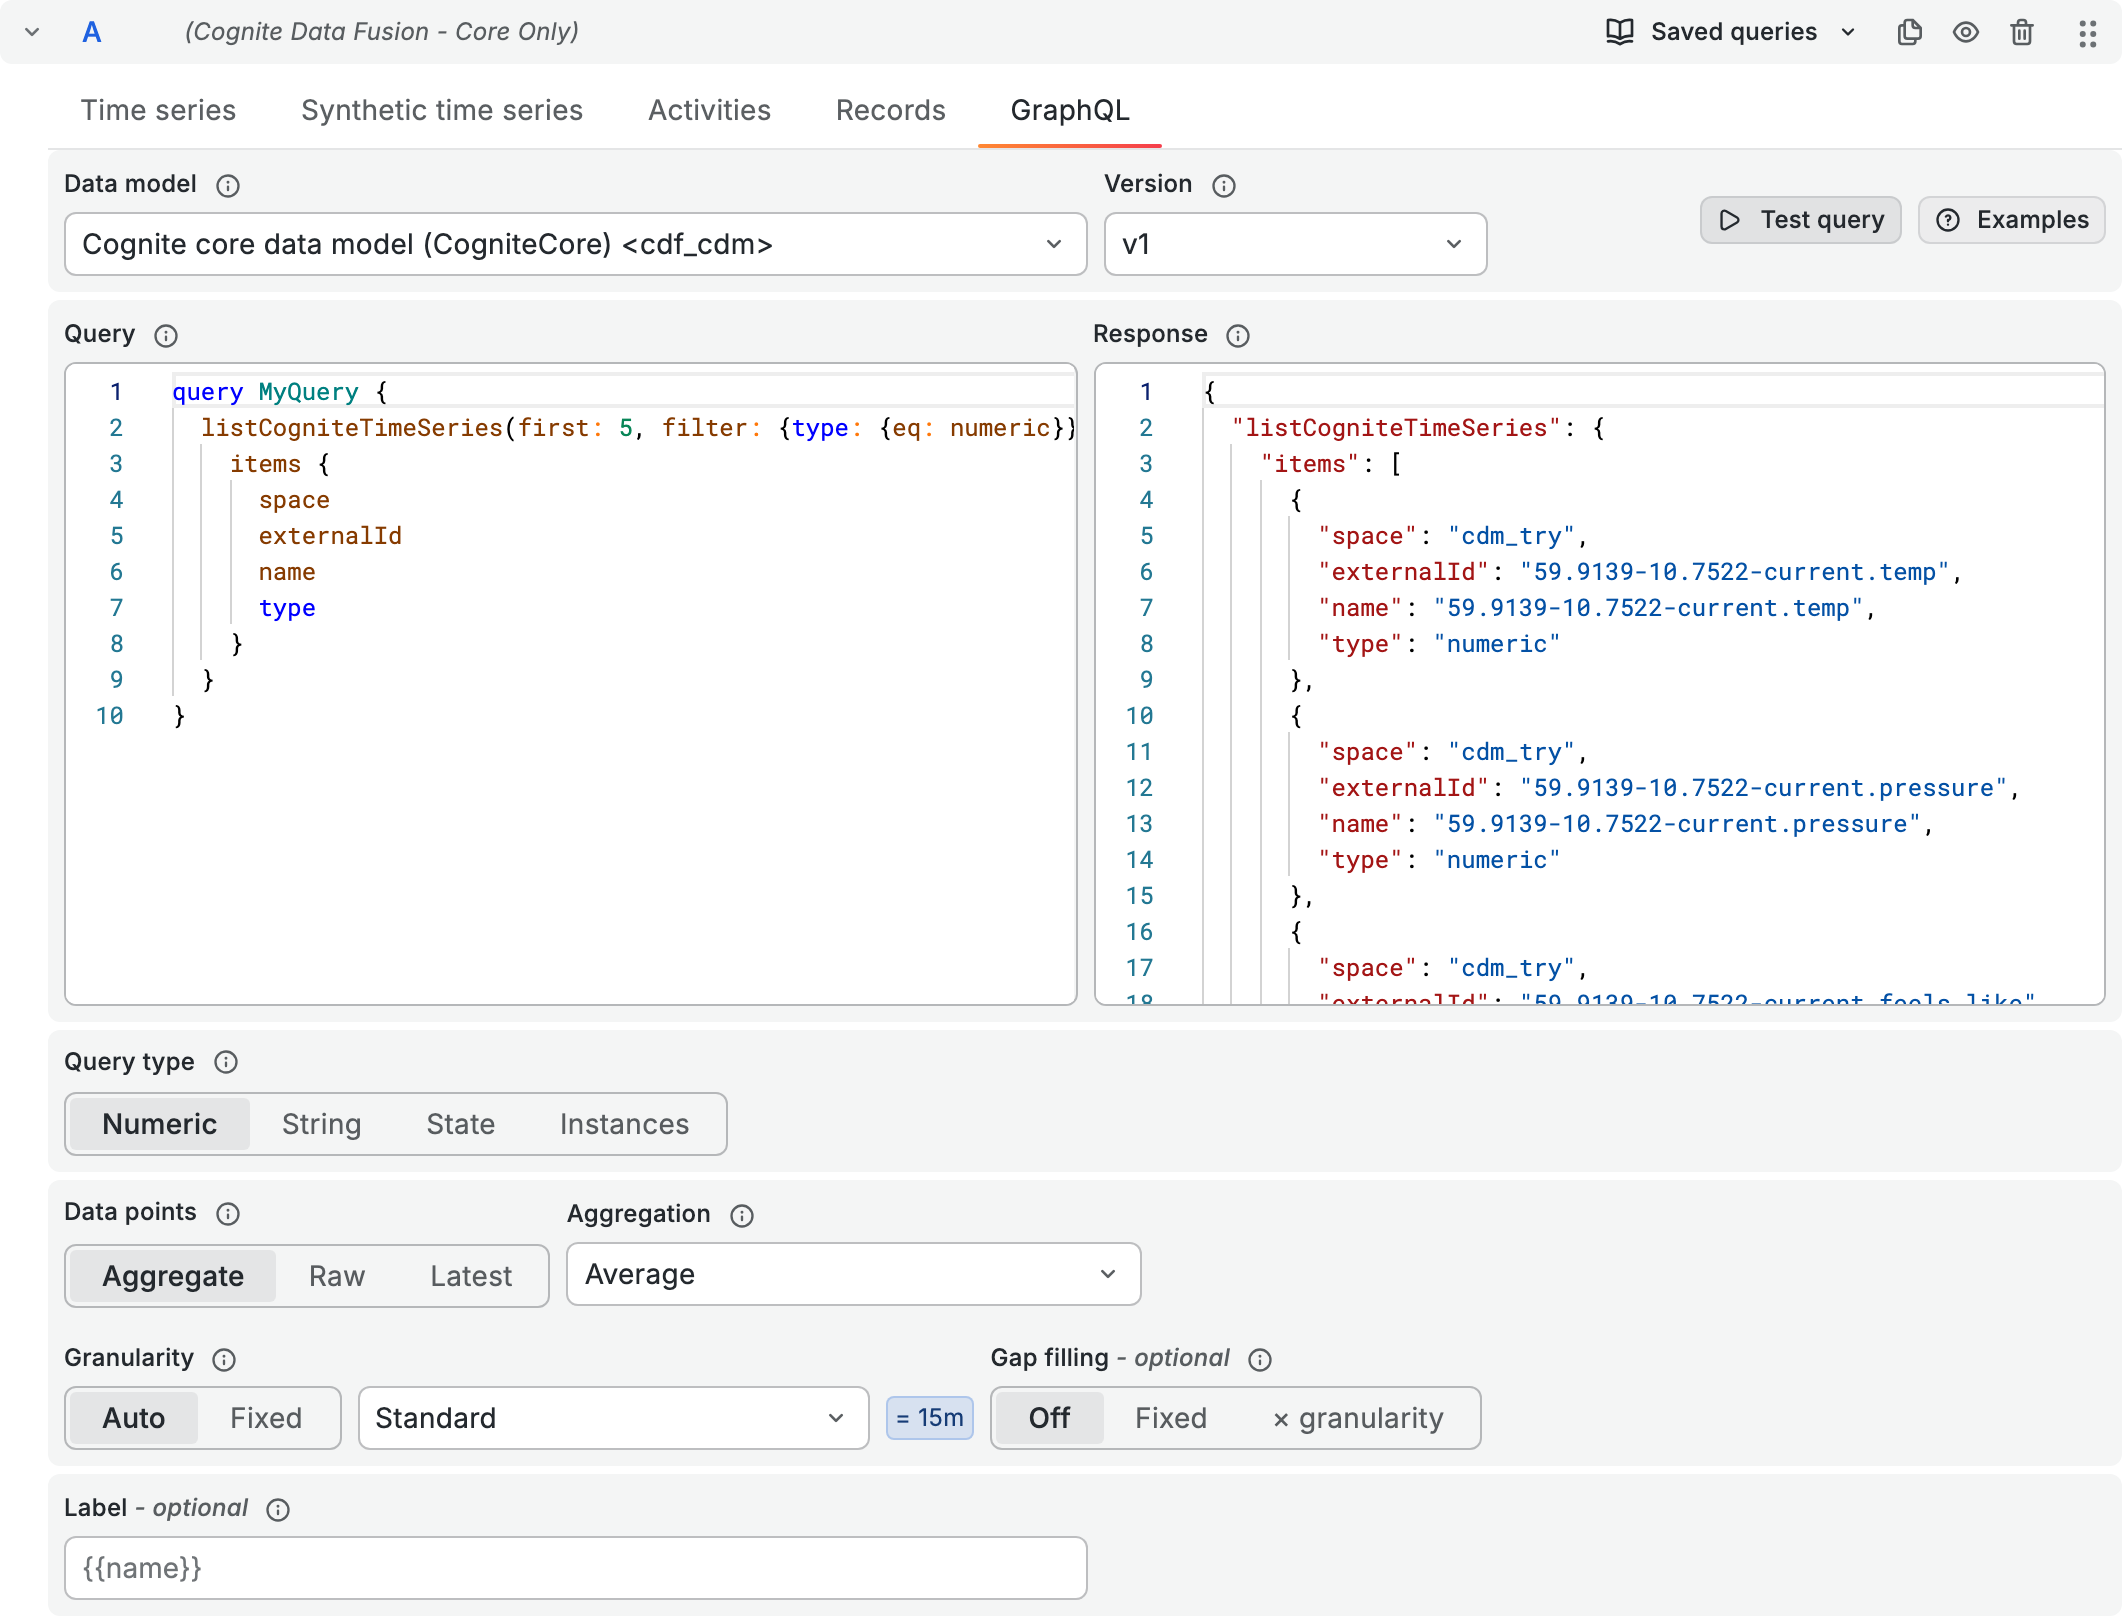
On the GraphQL tab, select the Data model and Version.
2
Choose the query type
In the Query type field, choose what the panel fetches.
With a time series query type, the panel skips time series of other types and shows a warning that names them. To plot time series of several types, add one query for each type.
3
Write the query
In the Query field, write the query. With Instances, select the fields you want as columns. With a time series query type, select The tab uses the data model schema to find time series in the response. It plots every row, or field on a row, whose type is
space and externalId on each time series to plot. For example, this query plots the time series linked to the first 10 activities:CogniteTimeSeries or a type that implements it.- For a relation to many instances, select the fields under
items. See GraphQLlistandgetByIdqueries with subqueries.
4
Test the query
Select Test query to run the query and show the raw response in the Response pane. The test sends the query exactly as the panel runs it, with dashboard variables filled in, and doesn’t save anything.If the query has a syntax error, the error appears next to the editor and you can’t test the query until you fix it. Until then, the panel keeps running the last valid query.
5
Set the data points and label
For every query type except Instances, set the Data points field the same way as on the Time series tab. See Query options for time series panels.In the Label field, use
{{field}} to insert any field you selected in the query, for example, {{name}} @ {{space}}. For time series reached through a relation, you can also use fields from the parent row. For example, in the query above, {{name}} is the time series name, and a field that only the activity has resolves against the activity. Hover over the field to see the fields that the current query offers. For state time series, you can also use the {{state}} token.If you leave Label empty, each series uses the time series name. The tokens read the response, so select the fields you use in the label in the query. See Labels.With Instances, the panel shows the rows of the query as a table. With a time series query type, it plots one series for each time series in the result, named by the label you set.
Using dashboard variables in GraphQL queries
Use$variable or ${variable} to insert a dashboard variable in the query. Grafana fills in the variables before the query runs.
If a variable holds instance references, the data source writes the variable as a GraphQL instance argument, {space: "...", externalId: "..."}, or as a list for a multi-value variable. Use this to filter on a direct relation. For example, this query lists the time series linked to the assets in the asset variable:
${asset.space} or ${asset.externalId} to insert one part of the reference. To learn how to create a variable that holds instance references, see Emit instance references. To use one variable in the query of another, see Chain variables.