

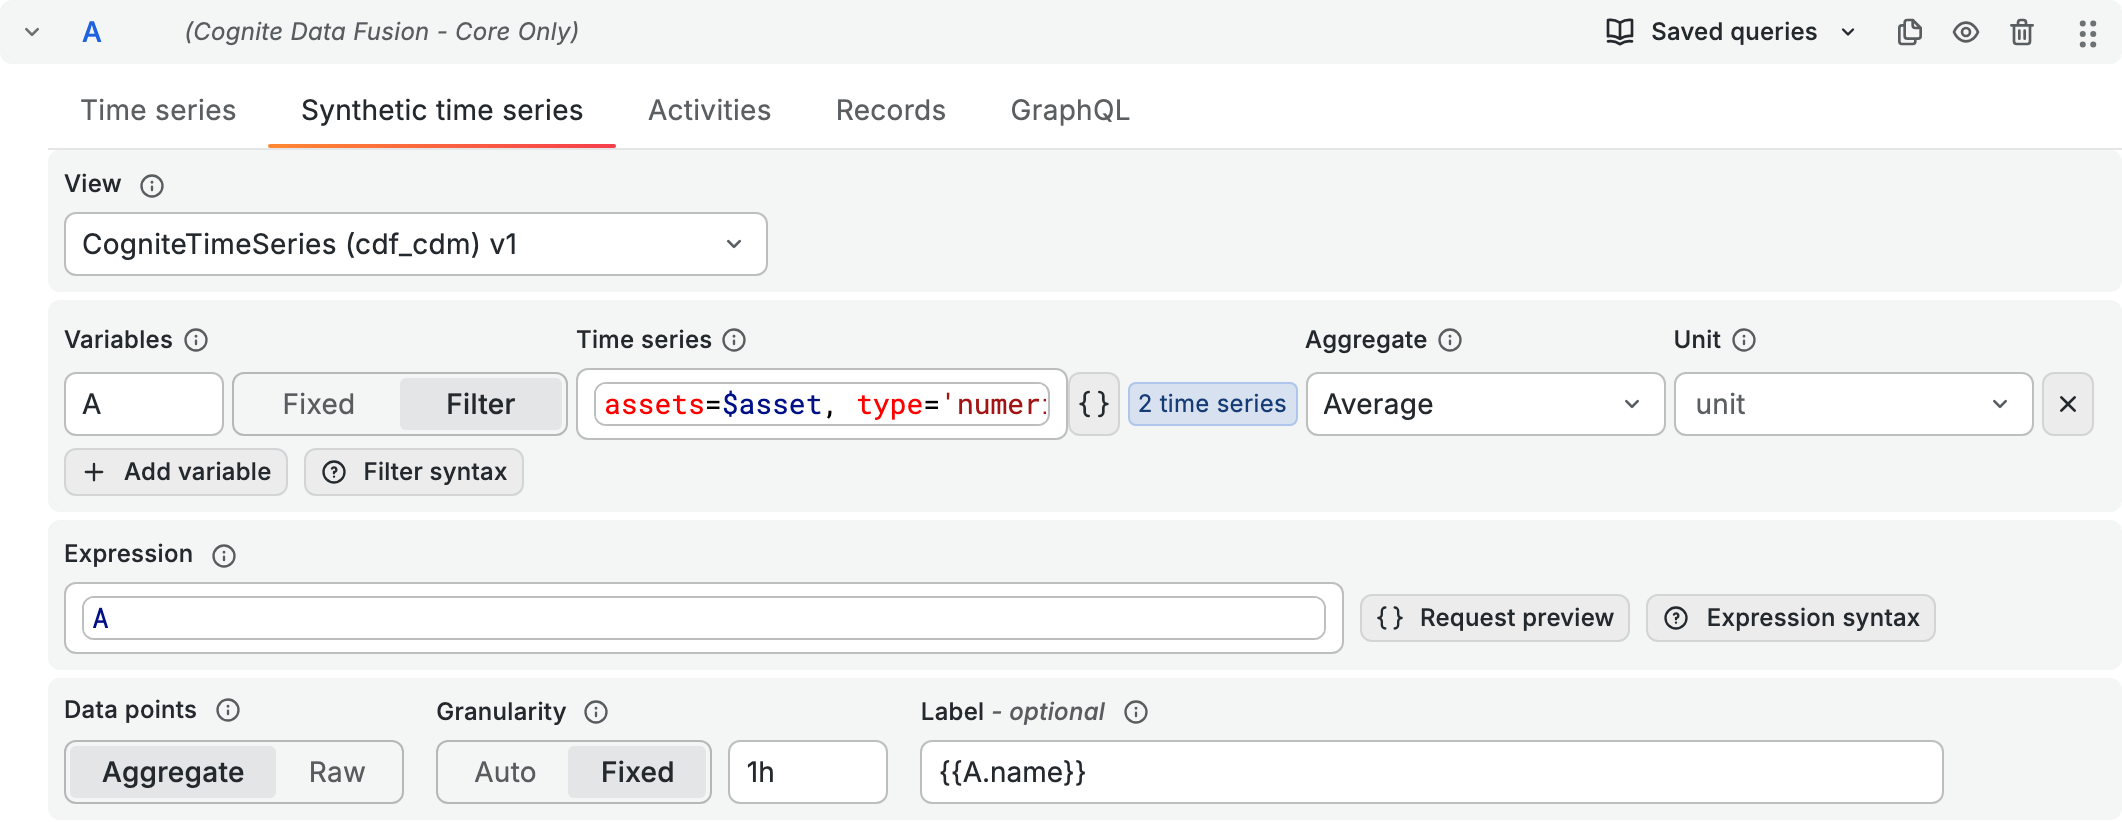
CogniteTimeSeries instances in Cognite Data Fusion (CDF), for example, the difference between two pressure readings. You define variables that each stand for one or more time series, and an expression that combines them. CDF evaluates the expression as a synthetic time series and returns the result to the panel.
Before you begin
- Make sure an administrator has set up the data source and turned on the Synthetic time series tab.
Computing a synthetic time series
1
Select a view
On the Synthetic time series tab, select the View to pick and filter time series from. A new query uses the
CogniteTimeSeries view of the core data model.2
Add variables
Each row under Variables defines one variable. A new query starts with the variable
A. Select Add variable to add more, up to 10.For each variable, set:- Name - the name you use in the expression. Use letters, digits, and
_, start with a letter or_, and use at most 32 characters. - Time series - choose Fixed to pick one time series by name, or Filter to use the time series that match a filter, for example,
name^='PT_', type='numeric'. See Writing filters. - Aggregate - how each interval is computed from the data points: Average, Interpolation, or Step Interpolation.
- Unit - optionally, convert the values to another unit or to a unit system.
{} to see the request the filter sends to CDF.3
Write the expression
In the Expression field, combine the variables by name, for example,
A * 2 or avg(B) - A. You can use arithmetic operators, parentheses, numbers, dashboard variables such as $factor, and the functions that synthetic time series support.The editor highlights what you type, suggests variables, functions, view properties, and dashboard variables, and underlines mistakes, such as a variable that no row defines. Select Expression syntax for examples.4
Set the data points, granularity, and label
- Data points - choose Aggregate to compute one value per interval with each variable’s aggregate, or Raw to use the data points as stored.
- Granularity - choose Auto or Fixed, as on the Time series tab. See Granularity.
- Label - the name of each result. Use
{{variable.property}}to insert a property of a variable’s time series, for example,{{A.name}}or{{A.name}} ({{A.unit.symbol}}). See Labels.
The panel shows the computed time series. If the expression uses a variable that matches no time series, or a variable that isn’t defined, the query row shows an error that names the variable.
Writing filters
A filter is a comma-separated list of conditions in the formproperty operator value, and a time series must match all of them. You can filter on the properties of the view and on space, externalId, createdTime, lastUpdatedTime, and version. Put text values in quotes, and write numbers, true, and false without quotes.
CDF applies these operators:
The data source applies the pattern operators
=~ and !~, and filters on nested values such as unit.externalId, to the results that CDF returns. These operators can see at most 100 time series, so combine them with = or ^= to narrow the results first.
To filter on a direct relation, use an instance reference, for example, assets={space='my_space', externalId='pump_01'}. On a list property, = means contains.
Select Filter syntax for more examples.
Use dashboard variables in filters
Write dashboard variables without quotes:name=$tagmatches any of the selected values, andname!=$tagmatches none of them.assets=$assetmatches the time series of the assets in a variable that holds instance references, andassets!=$assetleaves them out.${asset.space}and${asset.externalId}insert one part of each instance reference as a quoted value.
'$tag', takes a single value. The pattern operators =~ and !~ don’t accept instance references.
Combining several time series
A filter can match several time series. Only one variable in an expression can match several time series, and the panel then shows one result for each of them. Every other variable must match one time series, or be combined into one withavg(), sum(), min(), or max(), for example, avg(B) - A.
A filter uses at most the first 100 time series it matches. If the chip shows that a filter matches more, narrow the filter. To learn about the limits of synthetic time series requests, see Limits.
Using string and state time series
Expressions operate on numbers. To use a string or state time series, convert its values to numbers withmap(), and set Data points to Raw. The last argument of map() is the fallback for values that aren’t in the list.
- For a string time series, map the text values. For example,
map(A, ['OPEN', 'CLOSED'], [1, 0], -1)mapsOPENto 1,CLOSEDto 0, and every other value to -1. The values must match exactly, including upper and lower case. - For a state time series, map the state labels from its state set. For example,
map(A, ['OFF', 'ON'], [0, 1], -1)plots a pump status as 0 and 1. If a data point holds a state that is no longer in the state set, the expression returns an error despite the fallback. To return a value instead, wrap the expression inon_error(), for example,on_error(map(A, ['OFF', 'ON'], [0, 1], -1), -1).