Time concepts
The system uses these time-related concepts to manage the data sampling and validation process:
-
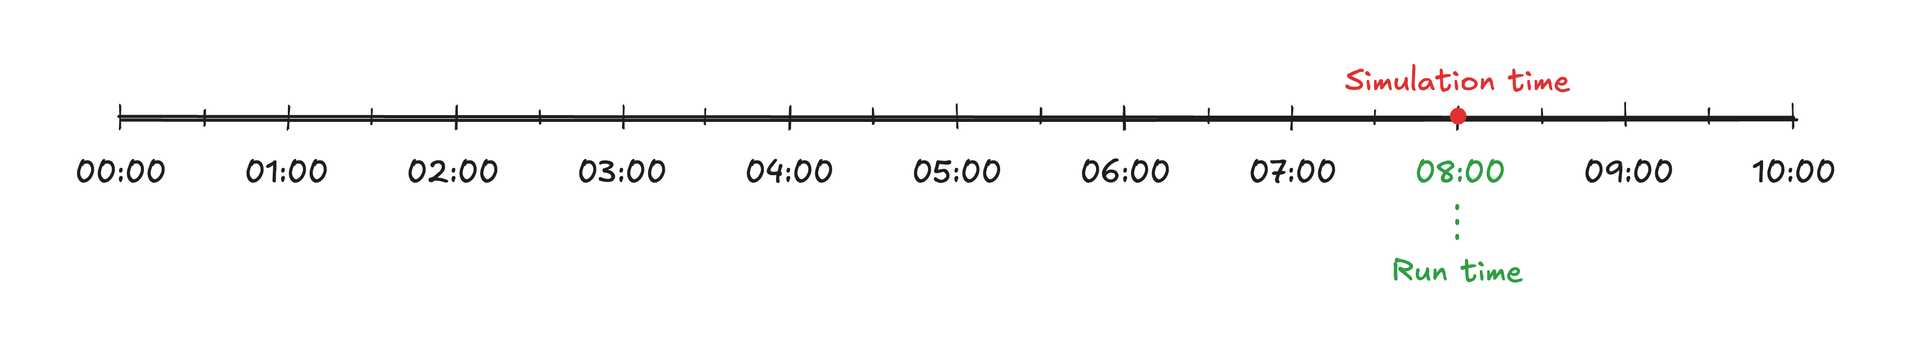
run time is the reference point for all data preprocessing activities. This is user-defined and defaults to when the simulation is triggered or when the schedule executes.
-
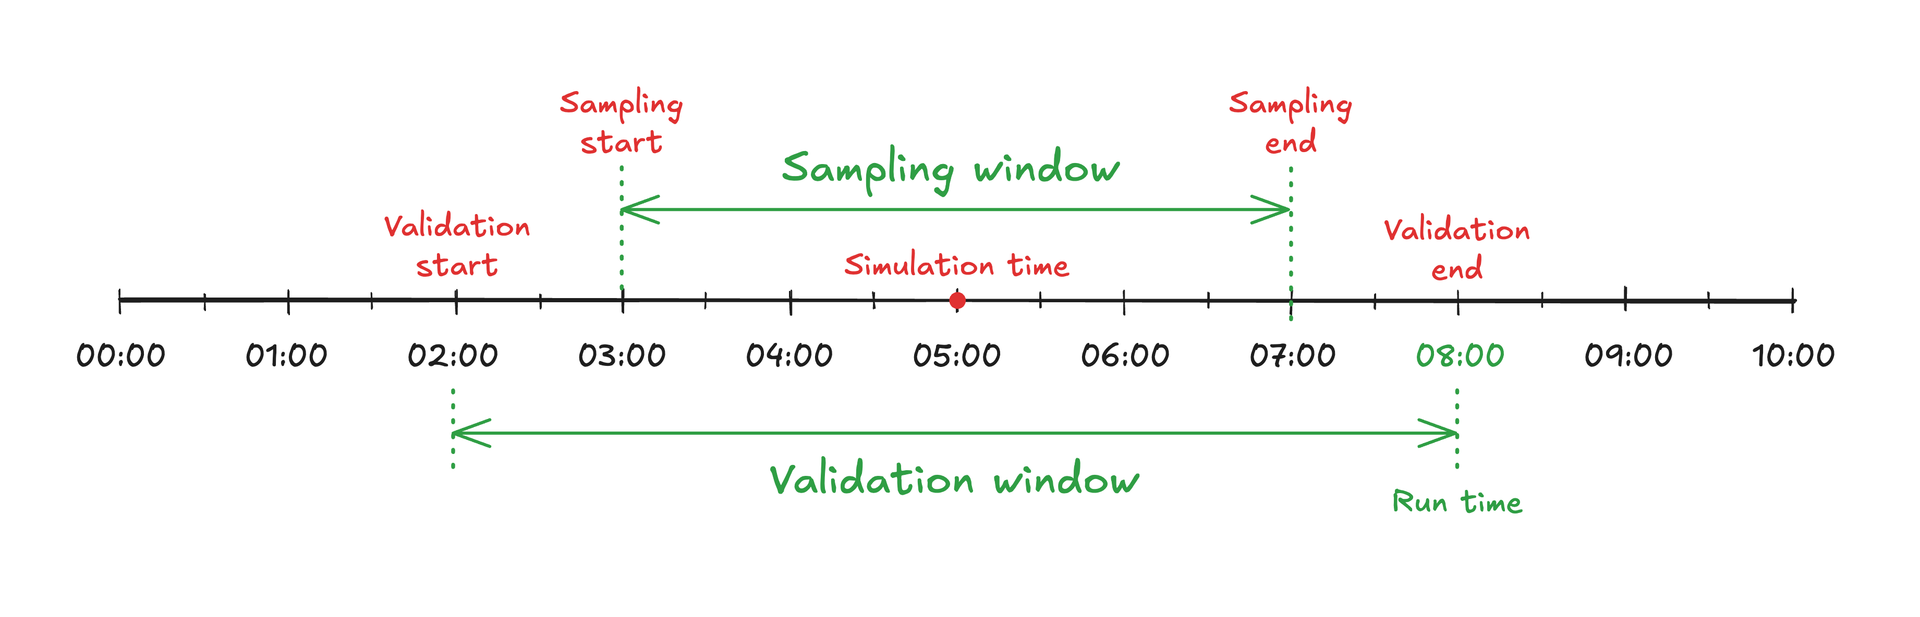
validation window is a user-defined duration that’s only relevant when data validation is enabled. The window represents the time range before the runtime where the system searches for valid data.
-
validation end is equal to the runtime.
-
validation start is calculated as validation end minus validation window.
-
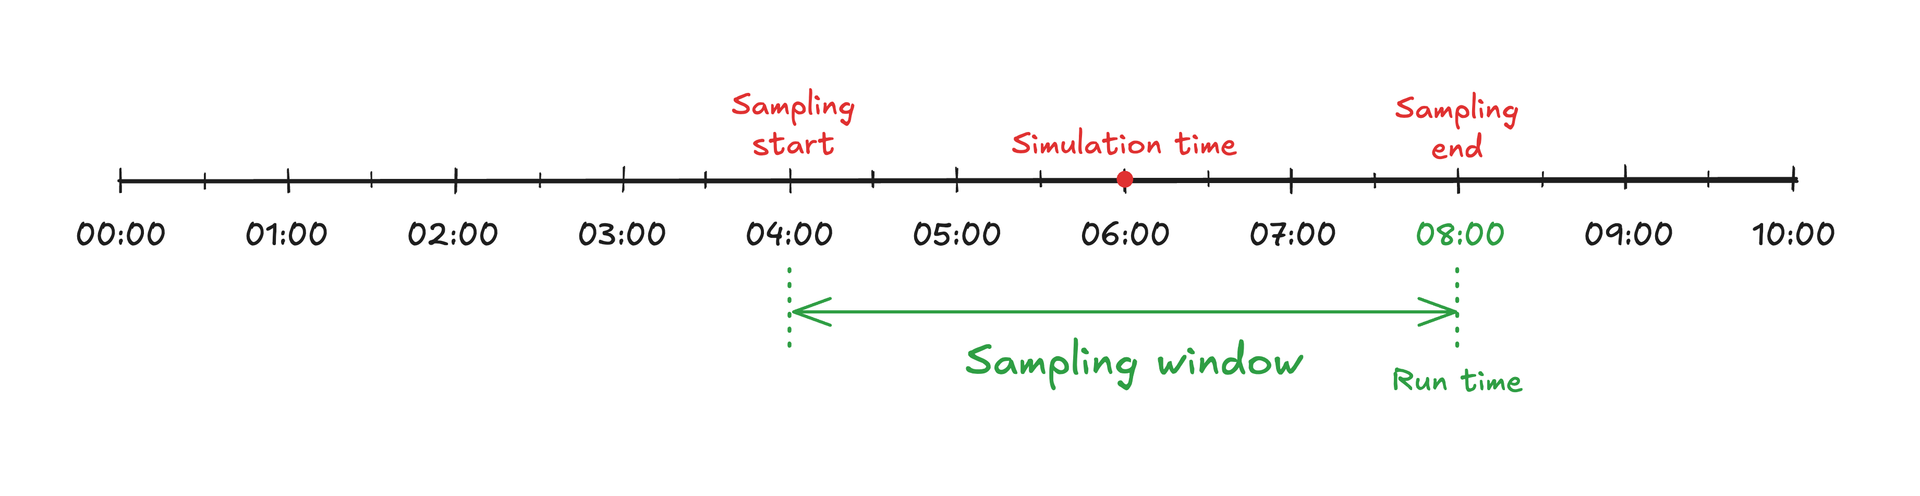
sampling window is the user-defined duration that determines the time range for sampling process data. This is only used when data sampling is enabled.
-
sampling end equals the runtime if data validation is disabled. Otherwise, it’s determined based on valid time ranges after data validation.
-
sampling start is calculated as sampling end minus sampling window.
-
simulation time represents the middle point of sampling window if data sampling is used. Otherwise, this equals the runtime. This timestamp is associated with your simulation results.
Data sampling
There are three approaches to data sampling, each with benefits and trade-offs:
Disabled data sampling: No data validation is performed. The simulation time is equal to run time, and the latest datapoints before run time are used for all input time series. This is the simplest option, but it might miss data quality issues.
Data sampling without validation: The system uses the sampling window to sample data between run time and sampling start, taking the average value inside the window. simulation time is located in the middle of sampling window. This option provides data smoothing but no quality checks.
Data sampling with validation: The system searches for valid time ranges inside validation window to determine if there’s a continuous time range up to the size of sampling window where process data can be sampled. The most recent valid time range is used as the sampling window, where data from the input time series is sampled as before. This is the most robust option for ensuring data quality.
Data validation methods
Use the data validation methods Logic validation and Steady State detection to check for valid process conditions before you select data for simulator runs. These methods can be used independently or combined to ensure appropriate simulation conditions.
Logic validation
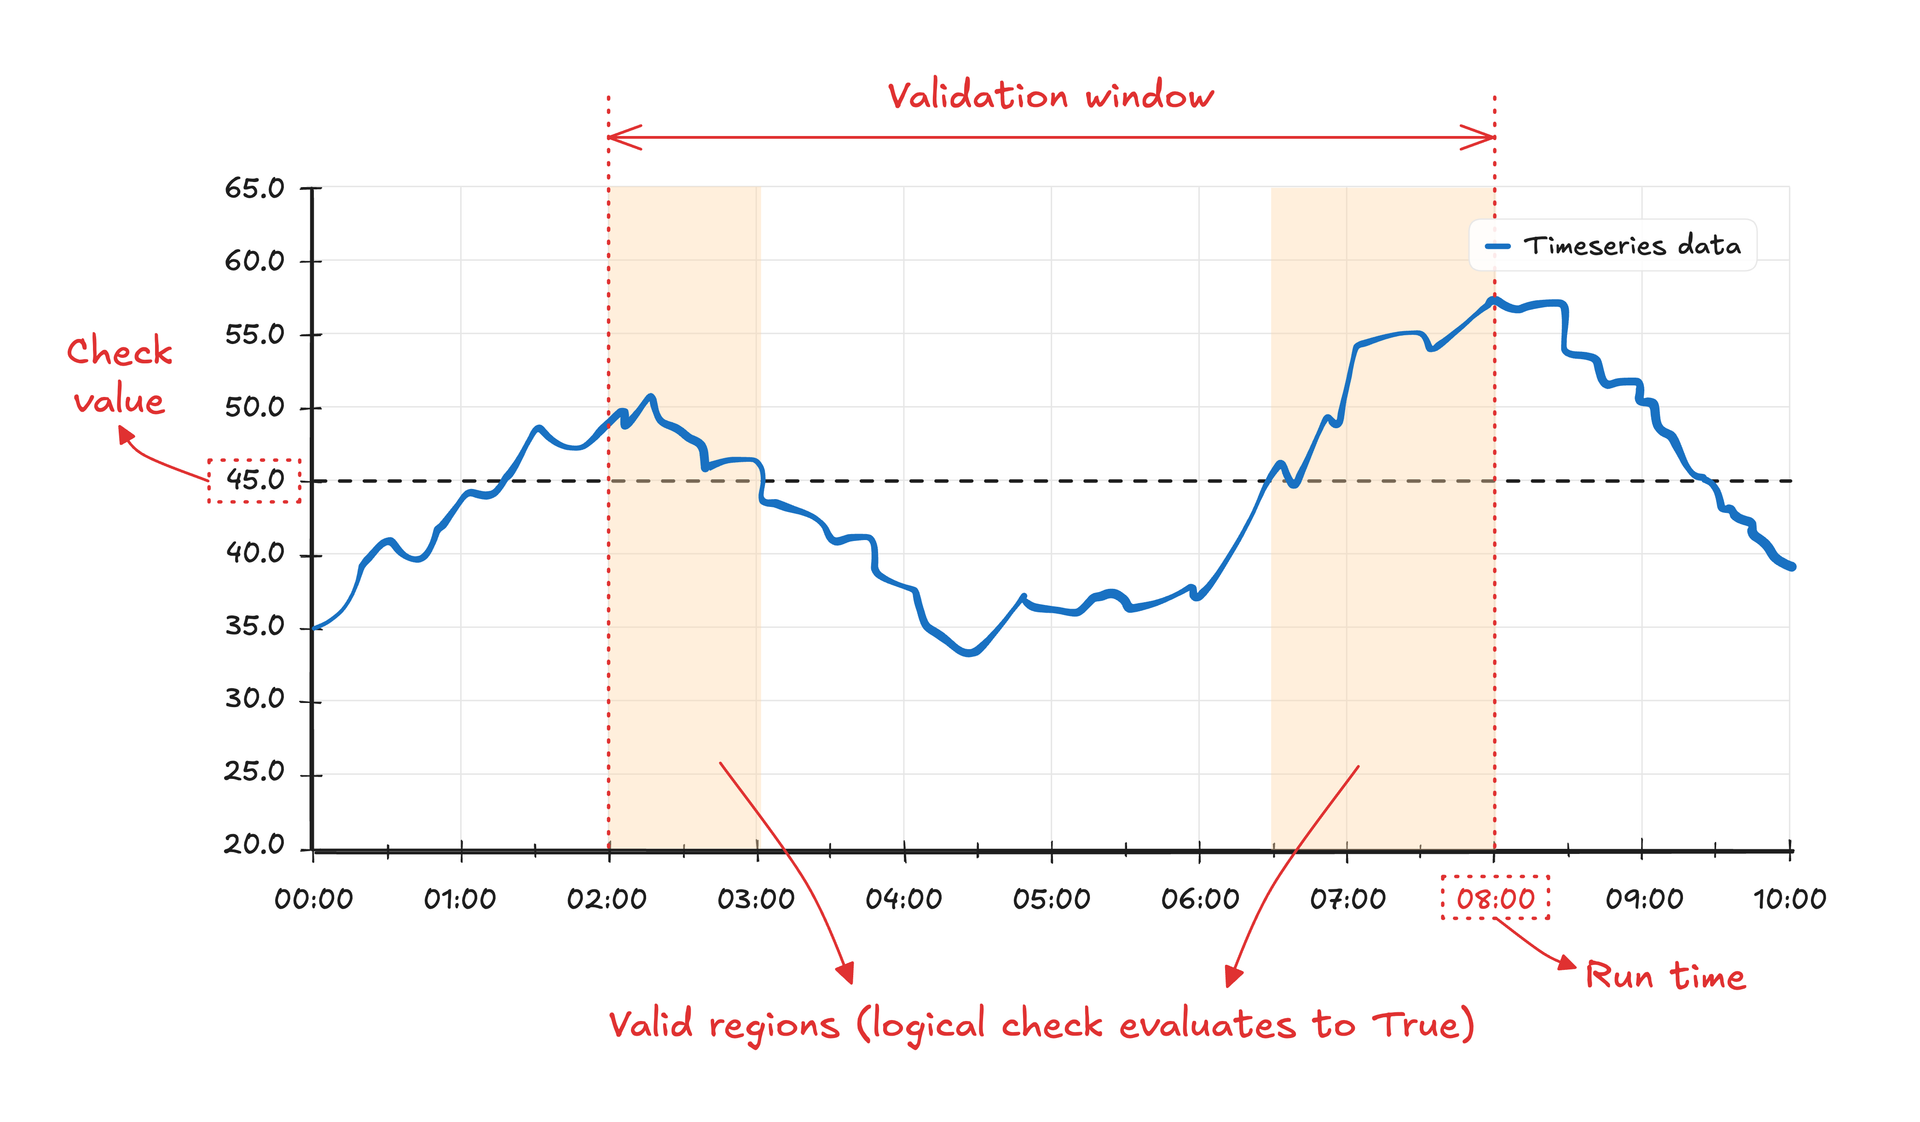
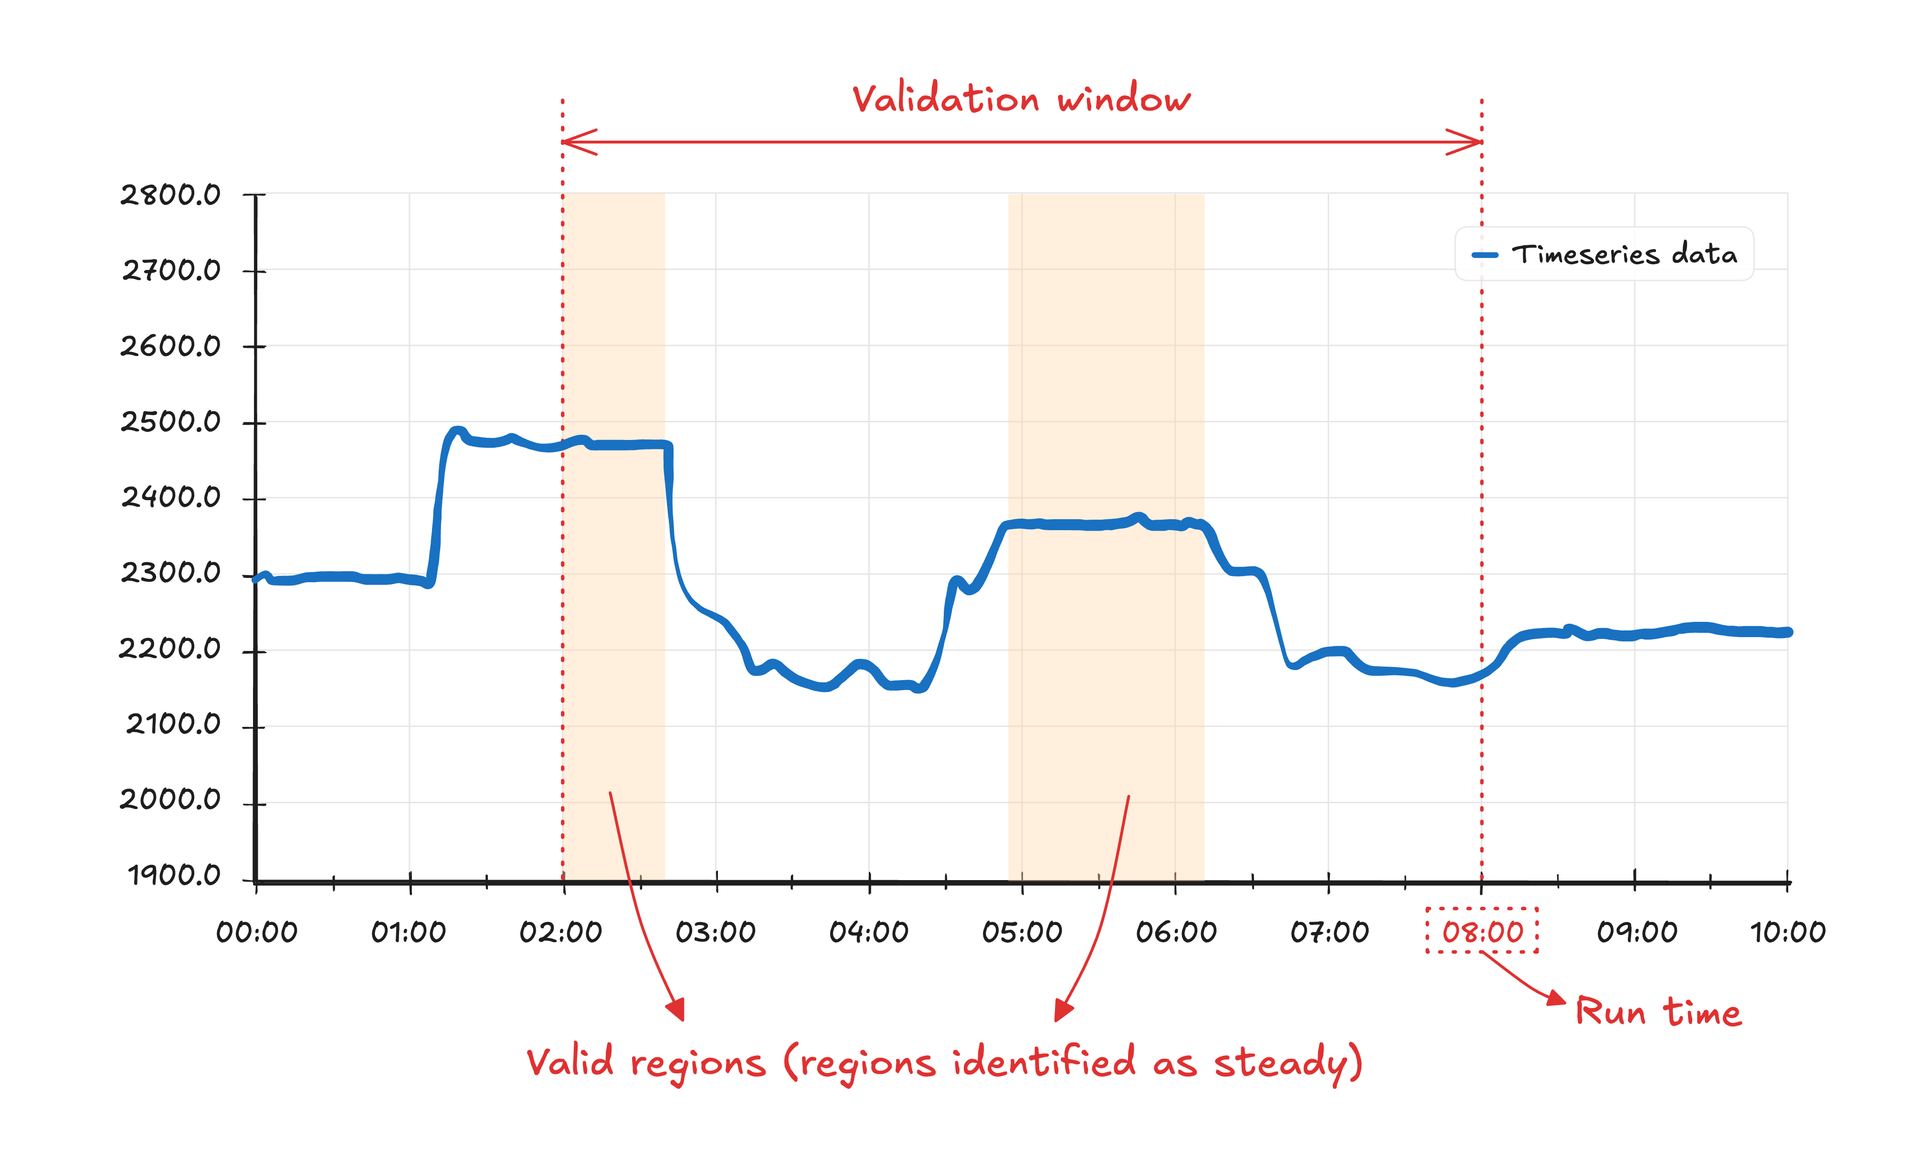
Logic validation checks if a specific condition is met in the time series data. Use this to verify that a pressure reading stays above a certain threshold, or that a given equipment is online. You specify the time series, logical operator, and value to check against. The system marks time periods as valid with a 1 when your condition is met, and invalid with a 0 when it isn’t met.
The image shows an example of the logic validation applied to some sensor data. The validation window is 6 hours, the logical operator is greater, and the value is 45.0. The yellow-hatched areas identify the time regions where the logical condition was met.
Steady-state detection
Steady-state detection looks for periods where your process is in a pseudo-steady state. This is important when sampling data for steady-state simulations. You specify the time series and the parameters: min section size, var threshold, and slope threshold. The system marks time periods which were identified as “steady” with 1, and “transient” periods with 0.
The detection method first splits the time series data points into statistically homogeneous segments using the ED Pelt change point detection algorithm. Each segment is then analyzed to determine if it represents a steady or transient period based on these parameters:
-
min section size specifies the minimum number of consecutive data points required for a segment to be considered in the analysis. This ensures that very short fluctuations aren’t mistakenly identified as steady states.
-
var threshold sets the maximum allowed normalized variance within a segment. If a segment’s normalized variance exceeds this threshold, it is classified as transient (0). This parameter helps identify regions where data remains consistently stable.
-
slope threshold defines the maximum allowed rate of change within a segment. The algorithm fits a line to each segment and compares its slope to 10 raised to the power of this threshold. Segments with slopes exceeding this value are marked as transient (0), helping to distinguish between truly steady regions and gradual changes.
This image shows an example of steady-state detection applied to some sensor data. The validation window is 6 hours, the min section size is 15, the var threshold is 3.5, and the slope threshold is -3.0. The yellow-hatched areas identify the time regions where the steady-state criteria were met.
Combined validation process
Sampling time is calculated with the results of the data validation methods:
-
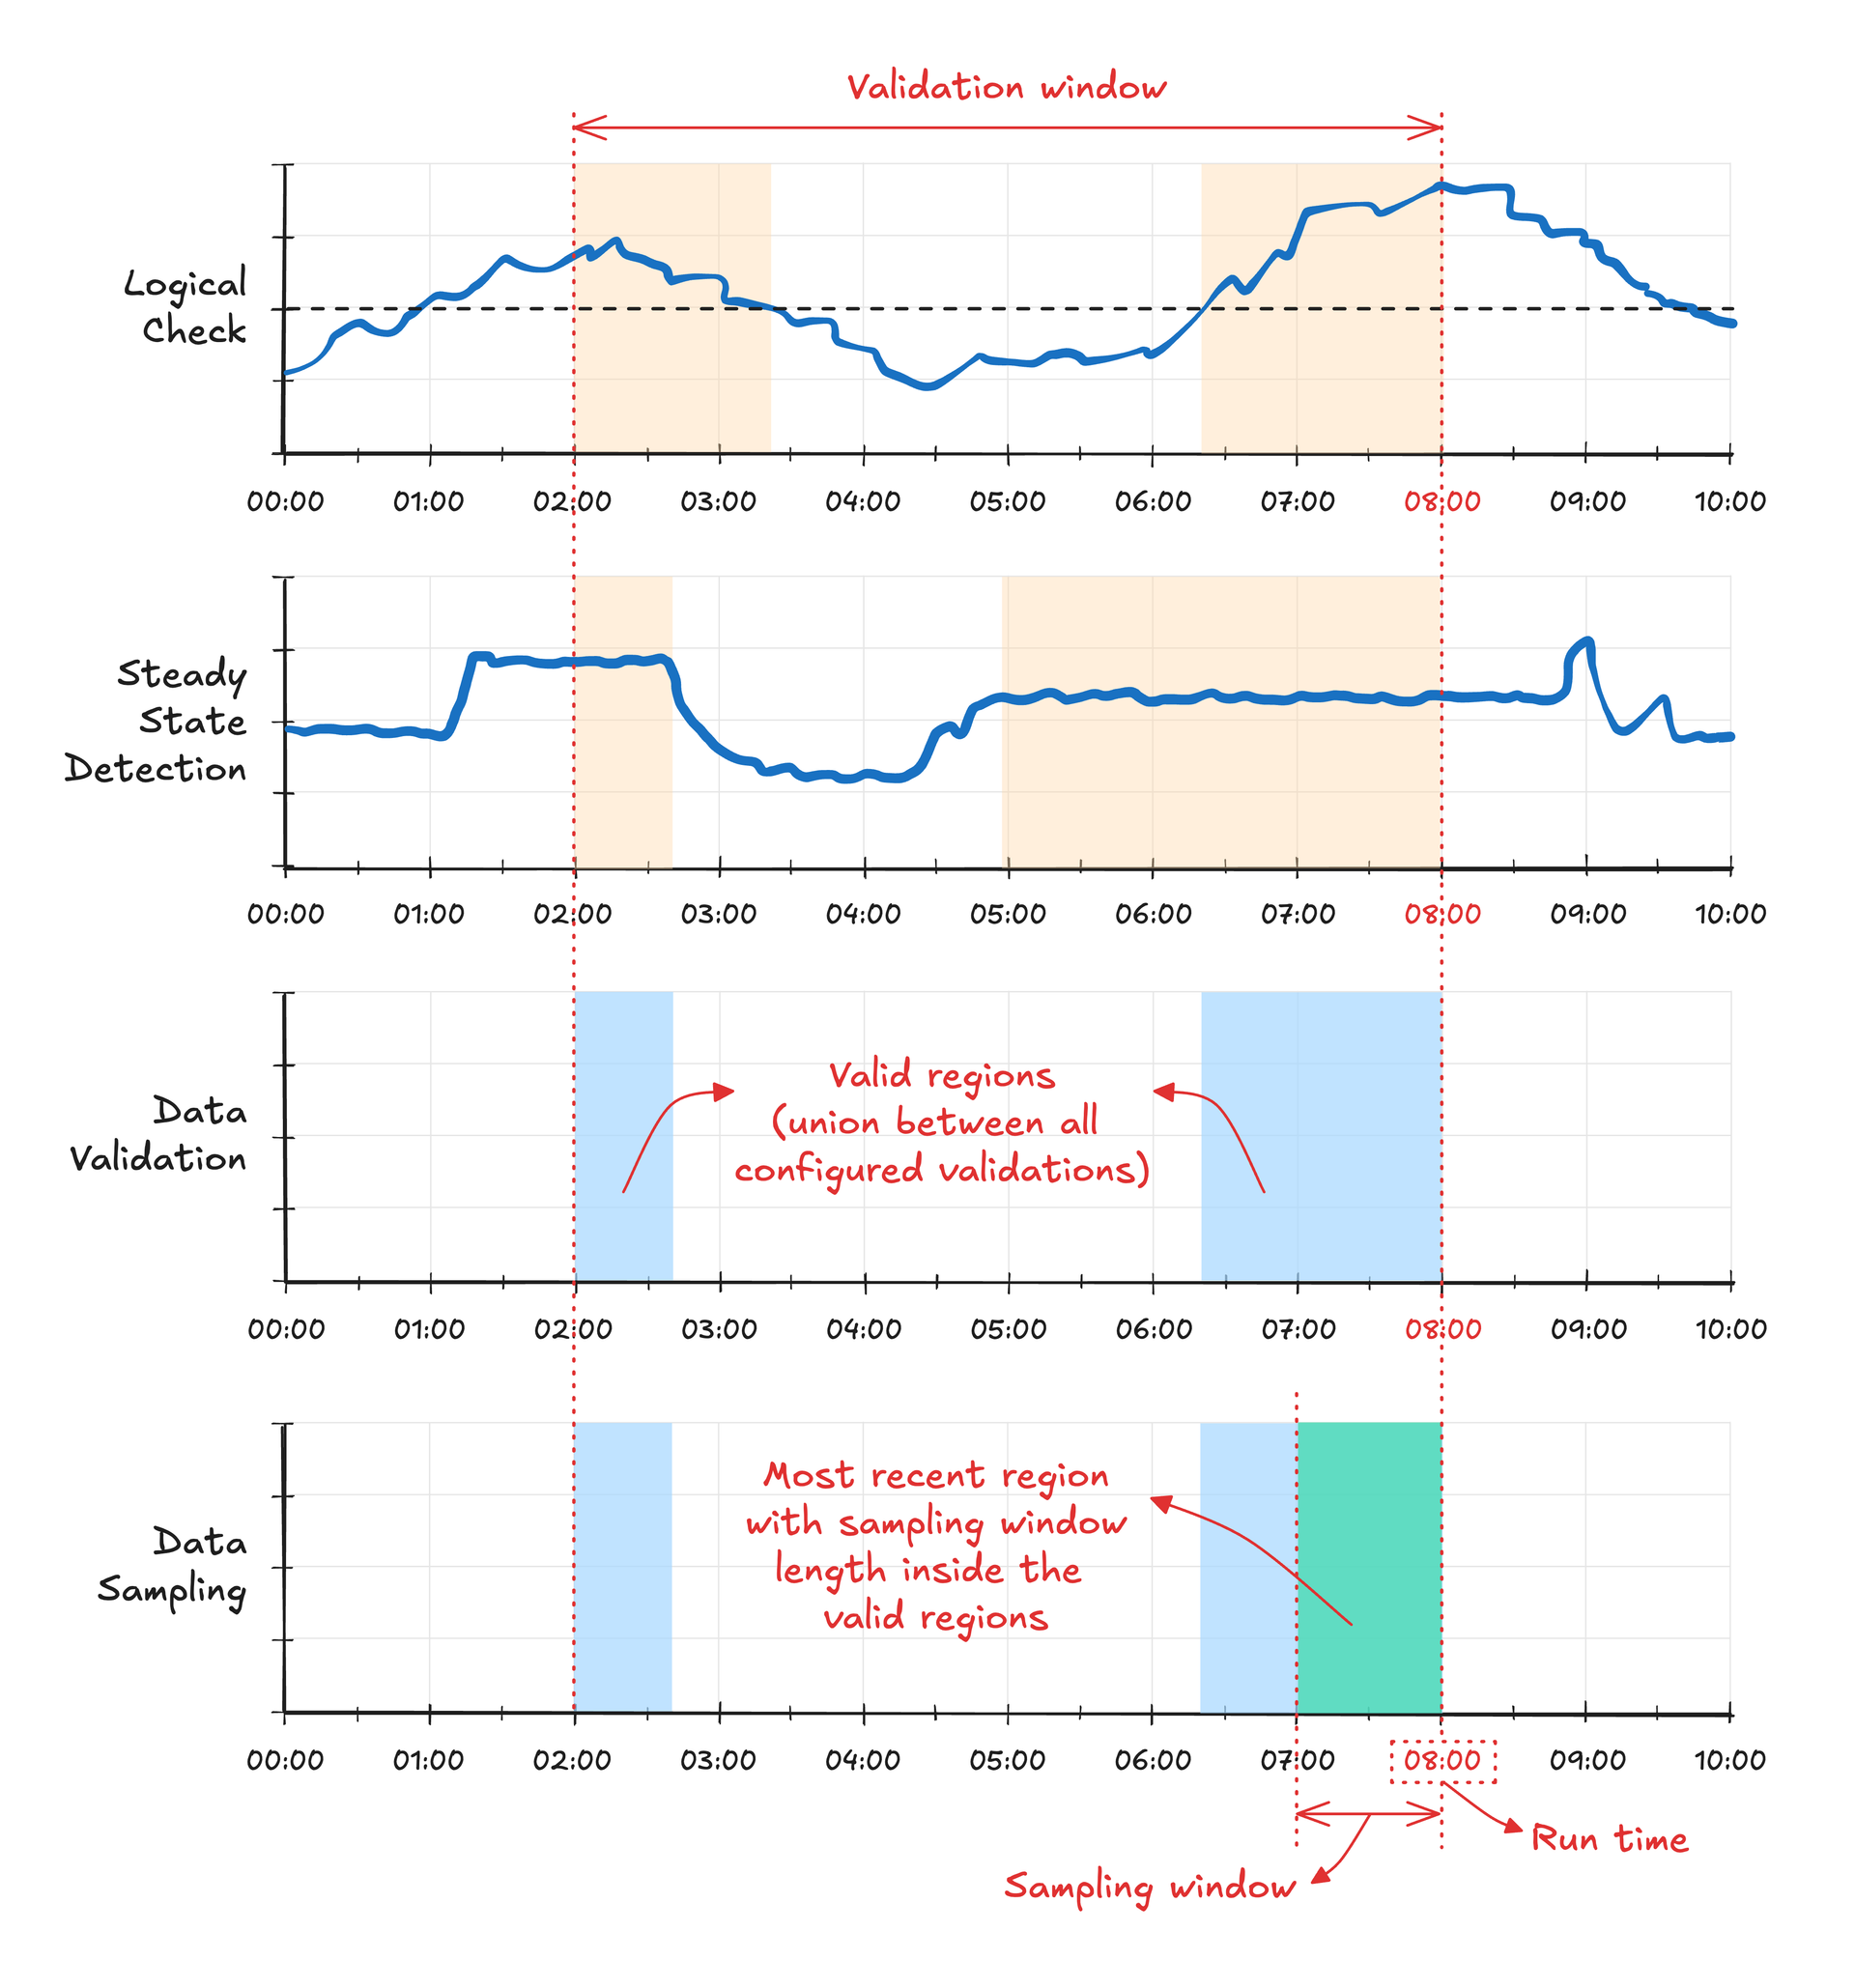
First, the valid timestamps are identified by calculating the intersection between all enabled data validation routines (when both return 1).
-
Then, the system checks if a continuous time range greater or equal to the sampling window size exists within the valid timestamps. The most recent time range with a size equal to the sampling window is selected to sample the input variables required for the simulation.
This image shows an example of the data validation process and the identification of the sampling time. The logical check and steady-state detection methods are enabled and identify the valid timestamps, marked as blue-hatched areas in the third plot. The timestamps are used to find the sampling time, marked as a green-hatched area in the fourth plot.
Best practices for data sampling and validation
-
Consider the process characteristics when you set thresholds:
- Align sampling windows with your process dynamics
- Use steady-state detection for simulations requiring steady conditions
- Apply logical checks when specific operating conditions must be met
-
Balance between data quality and simulation frequency:
- Stricter validation leads to more reliable results but potentially fewer successful runs
- Consider sensor reliability and data quality when setting validation parameters
- Monitor validation success rates to optimize settings
Proper data validation ensures simulation runs with reliable, stable input data, leading to more accurate results. However, it’s important to find the right balance between data quality requirements and operational needs for your specific use case.Last modified on December 9, 2025