Learn how Cognite Data Fusion aggregates and interpolates time series data, and see the details about the available aggregation functions.
Aggregation in Cognite Data Fusion
To improve performance and to reduce the amount of data transferred in query responses, Cognite Data Fusion pre-calculates the most common aggregates for numerical data points in time series. These aggregates are available with millisecond response time even when you are querying across large data sets.
In your queries, you can specify one or more aggregates (for example average, min and max) and also the time granularity for the aggregates (for example 1h for one hour).
Aggregates are aligned to the start time modulo of the granularity unit. If you ask for daily average temperatures since Monday afternoon last week, the first aggregated data point will contain averages for the whole of Monday, the second for Tuesday, etc.
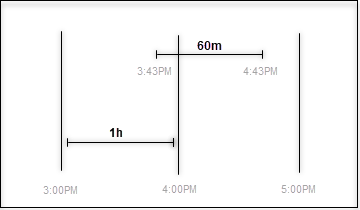
Cognite Data Fusion determines aggregate alignment based only on the granularity unit. If you specify hour aggregates, and the start time of the request is in the middle of the hour, the start time will be rounded down to the start time of the hour.As a result, you can get different results if you aggregate over 60 minutes than if you aggregate over 1 hour because the two queries are aligned differently. For example, if the start time is 3:43:25: Aggregating data points
Aggregation is to group together the values of many data points to form a single summary value. For example, the count aggregate gives the number of data points for a time range. The timestamp of the aggregate marks the beginning of the time range.
Interpolating data points
Interpolation is to construct new data points within the range of a discrete set of known data points. The returned data points have a timestamp and a value, where the value represents the interpolated value at the time of the timestamp. The interpolation method depends on whether the time series is stepwise or continuous. Interpolated data points aren’t stored and are only visible as the aggregation/interpolation results.
Stepwise vs continuous
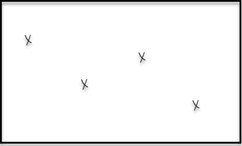
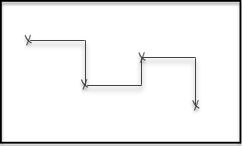
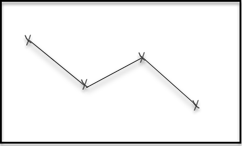
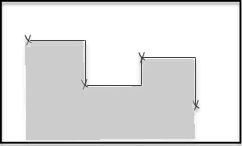
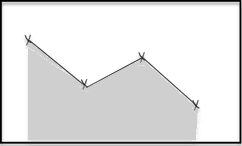
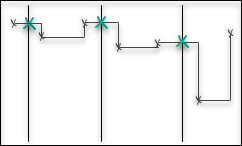
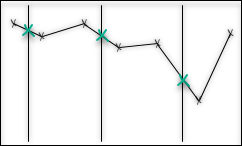
Interpolation and aggregation depend on how the time series is interpreted between the stored data points. A stepwise time series is assumed to keep its last reported value until a new value comes in, and then immediately jump to that new value. A continuous time series is assumed to gradually change between the stored data points and is modeled with linear interpolation.
| Data points | Stepwise interpretation | Continuous interpretation |
|---|
How the times series is interpreted affects the value of aggregates. For example, the average aggregate, which is based on the average distance to zero, will be calculated as the area below the curve, divided by the size of the time range.
| Stepwise interpretation | Continuous interpretation |
|---|
Granularity
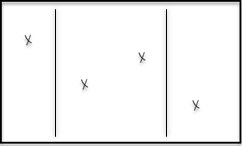
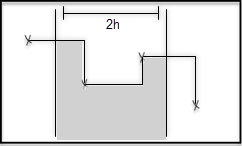
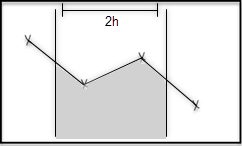
Granularity defines the time range that each aggregate is calculated from. It consists of a time unit and a size. Valid time units are day or d, houror h, minute or m and second or s, for example, 2h means that each time range should be 2 hours wide, 3m means 3 minutes.
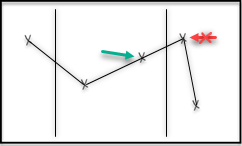
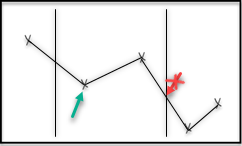
The value of an aggregate for a time range may also depend on data outside of the time range because lines have to be drawn to the edge of the time range to compute the aggregates.
| Data points | Stepwise interpretation | Continuous interpretation |
|---|
Missing data
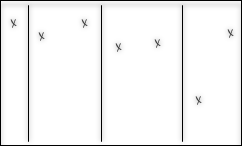
CDF doesn’t return aggregates or interpolations for time ranges that have no data points, even if there are previous and next data points present for that period. As a result, the returned aggregates may skip large periods of time if the underlying data is sparse.
Previous and next data point
To interpolate a time series to the edges of the time range, many aggregates and interpolations depend on knowing the last data point before the time range, and the first data point after.
For continuous time series, CDF doesn’t use the previous and next data points if they’re more than one hour away from the time range. This is to avoid interpolating data when the underlying sensor has been down for an extended period of time.
For stepwise series, CDF uses the previous and next data points regardless of how distant they are.
We do not extrapolate backward from the first point in a time series or forward from the last point.
This is also the case in stepwise time series, even though they are assumed to continuously maintain the value of the previous data point until the next point appears.
The rationale behind this is that we can not know the reason that the sensor isn’t sending new data: it could be because the value is unchanged, or because the sensor is down.
We want to avoid implying that the sensor is always up.
Aggregation functions
To use the aggregation functions, you construct requests that look like this:
POST /api/v1/projects/{project}/timeseries/data/list
Content-Type: application/json

{
  "items": [
    {
      "limit": 10000,
      "externalId": "your external id",
      "aggregates": ["aggregate function 1","aggregate function 2"],
      "granularity": "1h",
      "start": 1541424400000,
      "end":"now"
    }
  ]
}
| Function | How it’s calculated | When to use |
|---|
| average | Integral of time series divided by the size of time range. | Downsampling many noisy RAW data points. |
| max | The highest value of all stored data points. | |
| maxDatapoint | The highest value, along with its timestamp, of all stored data points. | |
| min | The lowest value of all stored data points. | |
| minDatapoint | The lowest value, along with its timestamp, of all stored data points. | |
| count | The count of stored data points. | |
| sum | The sum of values of all stored data points. | |
| interpolation | The interpolated value at the start of each time range. | Interpolating sparse irregular data to regularly spaced time series. |
| stepInterpolation | The interpolated value at the start of each time range, treating time series as stepwise. | |
| continuousVariance | The variance of the underlying function when assuming linear or step behavior between data points. | Uneven spacing between data points, if interpolation is a good assumption. |
| discreteVariance | The variance of the discrete set of data points, no weighting for density of points in time. | Evenly spaced data points. |
| totalVariation | The sum of absolute differences between neighboring data points in a period. | Data quality checks or outlier detection. |
| countGood | The count of stored data points with a good status code. | |
| countUncertain | The count of stored data points with an uncertain status code. | |
| countBad | The count of stored data points with a bad status code. | |
| durationGood | Duration of data points with a good status code. | |
| durationUncertain | Duration of data points with an uncertain status code. | |
| durationBad | Duration of data points with a bad status code. | |
average
| Data points | Stepwise interpretation | Continuous interpretation |
|---|
The average function computes the time-weighted average value of the time series, for each time range.
The value is defined as the integral of the time series divided by the length of the time range.
In the figures, this is represented as the average height of the grey area.
To retrieve the average value of the individual data points (arithmetic mean), use the sum function, divided by the count function.
The average function interpolates between data points, also if these are outside the time range,
and can thus differ significantly from the average of the individual data points. It can even be greater/smaller than max/min.
| Continuous time series with no previous data points |
|---|
max
For each time range, the max function returns the highest value of the stored data points in the time range.
The function doesn’t include interpolated values at the edges of the time range. This means that the average can be greater than max.
maxDatapoint
maxDatapoint is the same as max, but it returns an object with the highest value and its timestamp. If there are multiple data points with the same maximum value, the one with the earliest timestamp is returned. If includeStatus is true, we also return the status code where it is not Good.
min
For each time range, the min function returns the lowest value of all stored data points.
The function doesn’t include interpolated values at the edges of the time range.
minDatapoint
minDatapoint is the same as min, but it returns an object with the lowest value and its timestamp. If there are multiple data points with the same minimum value, the one with the earliest timestamp is returned. If includeStatus is true, we also return the status code where it is not Good.
count
The count function returns the number of data points for each time range. If there are no data points in a time range, this function returns no data.
sum
The sum function returns the sum of the values of all data points in the time range, or nothing if there are no data points.
interpolation
The interpolation function interpolates the value of the time series at the start of each time range. The method of interpolation is based on whether the time series is continuous or stepwise.
Note: For stepwise time series this is the same as the stepInterpolation function.
| Data points | Stepwise interpretation | Continuous interpretation |
|---|
stepInterpolation
Same as interpolation, but always treats the time series as stepwise.
continuousVariance
The variance of a function f is the expectation value of f squared, minus the square of the expectation value of f.
If CDF only has the value of f in a finite number of points, there are different approaches to approximate the variance. The continuous variance aggregate is intended for situations where the piecewise linear function that interpolates between the data points is a good approximation. If this function is f, CDF defines the continuous variance in a time period from t=a to t=b as:
Vc=b−a1∫abf(t)2dt−(b−a1∫abf(t)dt)2
The time intervals between data points can vary due to a sampling setting that tries to capture the behavior of f with a piecewise linear function (or a step function) using relatively few data points. These are cases when the continuous variance is a meaningful variance for the function. On the other hand, if the data points are sampled at even time intervals, independently of the value of f, the piecewise linear function will cut away extremal points, and CDF will get a variance lower than the actual variance.
discreteVariance
The discreteVariancefunction is for cases where the data points are measured at regular time intervals, independently of the values they measure. In these cases, CDF can regard the data points as a random sampling of the values in the time period. CDF defines the variance as:
Vd=n1i=1∑nf(ti)2−(n1i=1∑nf(ti))2
totalVariation
The totalVariation function returns the total absolute change in the function values within a time interval. If the time interval goes from t=a to t=b with n data points, the total variation is defined as:
V=∣f(t1)−f(a)∣+i=1∑n−1∣f(ti+1)−f(ti)∣+∣f(b)−f(tn)∣
CDF uses the interpolated values for f at a and b.
status code aggregates
The count<status> and duration<status> aggregates use the status code of the data points, not the values. Only the main status codes, Good, Uncertain, and Bad are used.
The count<status> aggregates returns the number of data point in each interval with the given status.
The duration<status> aggregates adds up the duration (milliseconds) the time series has in the given status. Equivalent, the duration that the previous data point has the given status, and is in range.
These aggregates do not take treatUncertainAsBad or ignoreBadDatapoints into account, unlike the other aggregates.
state aggregates
State time series support specialized aggregations for analyzing discrete operational states and state transitions:
| Function | How it’s calculated | When to use |
|---|
| stateCount | The number of data points for each state in the time range | Analyzing state frequency within periods |
| stateTransitions | The number of transitions into each state | Detecting state change patterns and equipment cycling |
| stateDuration | The total time (milliseconds) spent in each state | Calculating uptime, downtime, or state-based KPIs |
stateCount
For each time range and each state, the stateCount aggregate returns the number of data points with that state. This only counts data points with a Good status (or Uncertain if treatUncertainAsBad is false).
The results are returned in the stateAggregates array, with one entry per state present in the time range.
stateTransitions
For each time range and each state, the stateTransitions aggregate counts the number of times the equipment transitioned into that state from a different state (or bad status).
The first data point of a time series is counted as a transition if it has a Good status (or Uncertain if treatUncertainAsBad is false). Transitioning from no state to an initial state counts as a transition.
- Equipment cycling patterns (frequent
ON/OFF transitions).
- State instability.
- Equipment behavior anomalies.
stateDuration
For each time range and each state, the stateDuration aggregate returns the total time (in milliseconds) the equipment was in that state.
State durations only extend to the end of an aggregate period if there is a subsequent data point after the period ends.For example, if a state changes from CLOSED to OPEN at 08:00, the CLOSED duration will be calculated up to 08:00, and the OPEN duration will be zero. This applies regardless of the current time or the end of the aggregate period, unless there is a new data point after the aggregate period ends.
- Calculating uptime/downtime percentages.
- State-based performance metrics.
- Compliance reporting (time in specific operational modes).
Traditional numeric aggregations (like min, max, average, sum, variance) are not applicable to state time series and will return an error if requested.
