

data-quality section, the differences between PI and CDF will be logged to the configured logger, sent to a Prometheus pushgateway using metrics, and written to a CSV file on exit using the report-file-name configuration parameter.
Logger output
PI replace logs the differences between the PI Data Archive and CDF with warning levels:-
TimeSeries1 (Numeric)is the data point number difference:-2/9indicates 9 data points in the PI Data Archive, but 2 are missing from CDF. -
TimeSeries4 (Numeric)is the data points’ value difference.3/7indicates that both CDF and PI have 7 data points, but 3 data points have different values in CDF compared to the data points in the PI Data Archive. -
TimeSeries5has no data points in CDF. For instance:Should have 6indicate that the time seriesTimeSeries5exists in CDF but has no data points. The same time series has 6 data points in the PI Data Archive.
CSV report
The PI replace utility writes a report with the differences between the PI Data Archive and CDF to a CSV file on exit: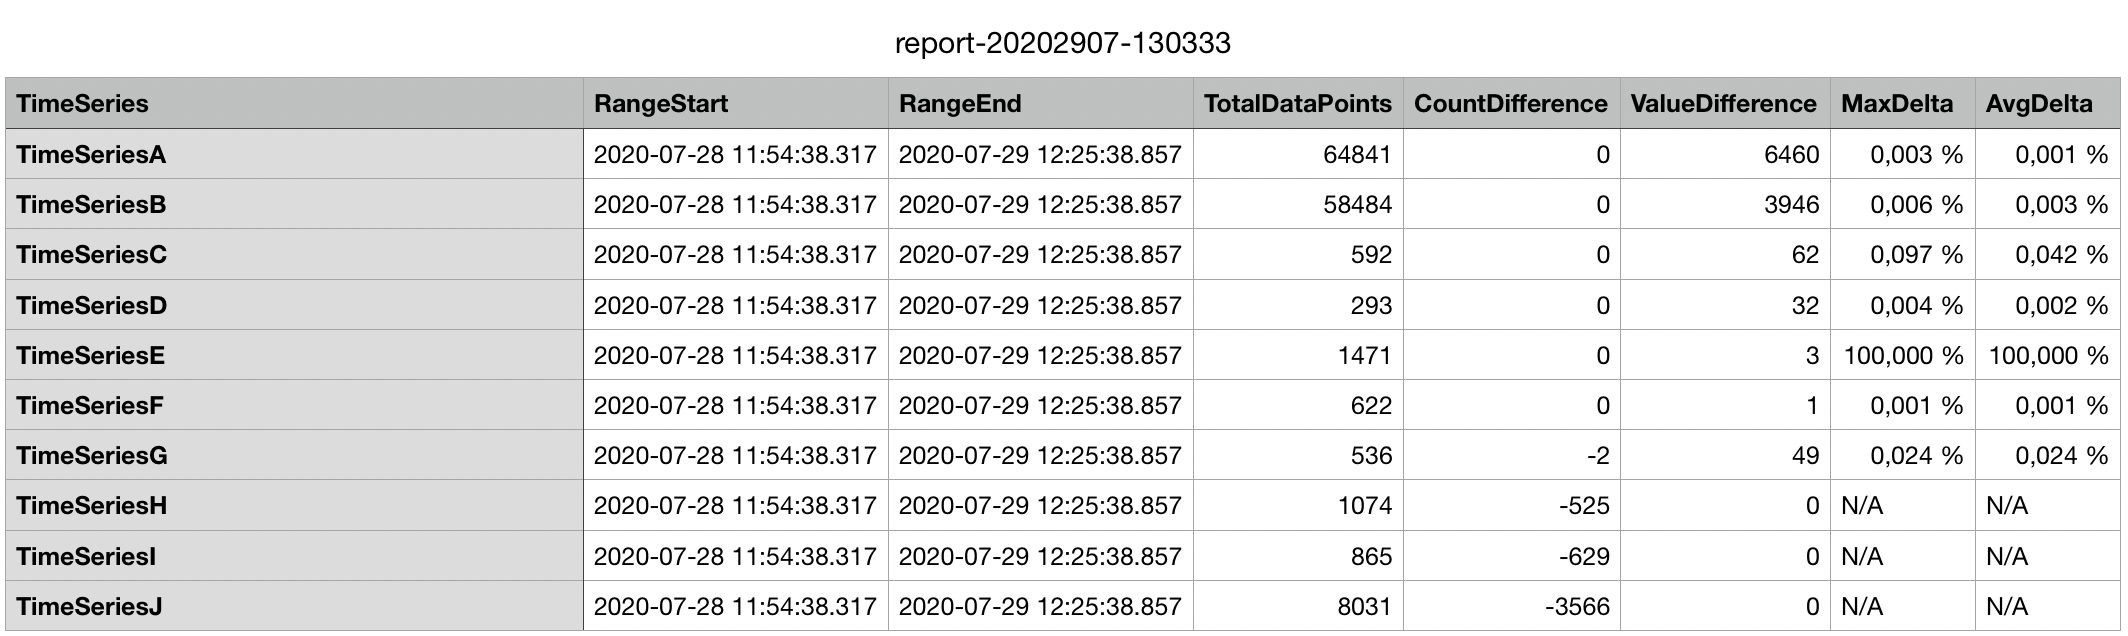
-
TimeSeries: Nameis the name of the time series. This is the PI Point name. -
RangeStartindicates that data points with timestamps higher than or equal to this date and time were replaced. -
RangeEndindicates that data points with timestamps smaller than or equal to this date and time were replaced. -
TotalDataPointsis the total number of data points in the PI Data Archive. -
CountDifferenceis the number of data points in CDF subtracted from the number of points in the PI Data Archive. -
ValueDifferenceis the number of data points in CDF that have different values than the data points in the PI Data Archive. -
MaxDeltais the maximum difference of the numeric data point values. The individual data point delta percentage is calculated as the fraction: (Value in PI - Value in CDF) / Value in PI -
AvgDeltais the average data point value difference.
Metrics
PI replace can send metrics to a Prometheus pushgateway. The metrics can be displayed in a Grafana dashboard and monitored by CDF.
Replace progress

Performance

Data quality

PI server
