> ## Documentation Index
> Fetch the complete documentation index at: https://docs.cognite.com/llms.txt
> Use this file to discover all available pages before exploring further.
# What's new in 2021
> Product updates and improvements to Cognite Data Fusion from 2021.
This release of Cognite Data Fusion (CDF) contains enhancements to all capabilities for ingesting, managing & building trustworthy industrial data products to be used for data-driven decisions.
**Data engineers** need observability to inspect, monitor, and debug solutions in production. Therefore, we're introducing **Extraction pipelines** where you can **monitor the status of data ingestions** to make sure reliable and trustworthy data are flowing into the CDF data sets. When you set up extraction pipelines, you can add comprehensive documentation and email alerts. You'll be instantly notified, can quickly start troubleshooting, and have on-the-spot contact info to data set owners and other stakeholders if ingestion issues occur. You create and view these pipelines either from the **Data set lineage** page while you are already working with a particular data set, or you can get a bird's eye view across several data sets via the **Monitor extraction pipeline** page. [Read more](/cdf/integration/concepts/extraction/index).
 If you're using the PostgreSQL gateway, you can add status reporting to your Azure Data Factory pipeline. If you prefer working more programmatically, the new version of the [Python Extractor Utils](https://cognite-extractor-utils.readthedocs-hosted.com/en/latest) allows building extractors with status reporting, or you can use the REST API or Python SDK. The Cognite Extractors support status reporting from our next release.
**Running SQL transformations using APIs and the Python SDK** significantly improves the developer experience as data engineers can manage transformations programmatically. Using the APIs/SDK, data engineers can orchestrate transformations sequentially, making it more reliable and quick. Check out the [API docs](/api-reference/concepts/20230101/api-description) and [SDK docs](https://cognite-sdk-experimental.readthedocs-hosted.com/en/latest/cognite.html#transformations) for more information. Note that the Transformations APIs and Python SDK are in public preview and will be promoted to V1 (production use) in November 2021.
**Data discovery by contextualizing engineering diagrams**, typically P\&IDs, has already shown its value in the market. In this release, we've redesigned and enhanced the **Create interactive engineering diagrams** process to give a delightful user experience. The new sidebar navigation guides you carefully through each step in finding, extracting, and matching tags and linking these to the asset hierarchy and other associated resource groups. New actions that **improve the quality** of the diagrams include approving and rejecting automatically detected tags, clearing all tags on a diagram, and better name-mapping and use of synonyms in tag detection. When you're done creating interactive diagrams, you can convert the approved PDF files to SVG if this is your preferred format. [Read the How-to guides](/cdf/integration/guides/contextualization/interactive_diagrams).
The **solution builders and data scientists** need transparent and easily accessible documentation and information about data science scripts and models to make correct and informed operational decisions. You'll find it all in the [Cognite Industrial Data Science Library](https://indsl.docs.cognite.com).
Industrial data analytics must be of high quality and **Cognite Charts** is focused on the nitty-gritty details and to give you a smooth charting experience. You'll find **function descriptions** by selecting the Information icon located next to a function. Notice also that **named inputs/outputs** in Cognite Charts make it clear to see which are required for a function. When you zoom in to a specific point on a time series, the aggregated values automatically switch to showing the **raw data**. In addition, **all** measurement units stored on time series in CDF are now displayed in Cognite Charts.
For the **solution builders**, we've enabled **client credentials grant flow in Grafana**. In some cases, for example, if you're using the Grafana free tier, you can not set up an identity provider for the whole Grafana instance. Instead, you need to set up a client credentials grant flow for each instance of the Cognite Data Source. You'll find all the information you need to set this up in [this article](/cdf/dashboards/guides/grafana/admin_oidc#set-up-a-client-credentials-grant-flow).
For the **CDF administrators**, we're introducing a new **token session service** for managing internal sessions and exposing internal and external endpoints for interacting with them. The token session API service allows users and service principals outside the API to run jobs within the API. External principals can use the sessions API to delegate their access to functionality in CDF. You can use this functionality to set up and manage long-lived or timed access for internal services. The access is rooted in the respective principal's external identity provider (IdP), from where it can be controlled or terminated. For example, a user can specify a function to be run on their behalf and terminated if their user account is deleted.
Today, we are happy to announce the release of the following improvements to Cognite Data Fusion (CDF).
#### Manage RAW foreign table in the Postgres Gateway
You can now manage the RAW foreign table in the Postgres Gateway using APIs and don't have to rely on external tools such as pgAdmin or psql CLI to create, list, update or delete the RAW foreign tables.
#### Update labels on assets
To make it easier to update labels on assets, we have added a set method in the [updateAssets operation](/api-reference/concepts/20230101/assets). The operation accepts a list of labels to set or replace for the resource.
#### Update sequence configuration
With the availability of [mutable sequences](/api-reference/concepts/20230101/sequences), you can now update an existing sequence configuration. In addition to adding, removing and updating columns in your sequence, you can also update or clear the assetId, externalId, metadata, and the dataSetId for a sequence. To update a sequence, you need `sequencesAcl:WRITE` capabilities.
#### Group limits
To support authentication for users who are members of a **large number of Azure AD groups** we have increased the default group limit token configuration to 1.000 for new CDF projects with AAD as the IdP from now on.
#### Interactive engineering diagrams
We're hard at work putting the final touches on our new user experience for working with interactive engineering diagrams. Stay tuned for the upcoming release.
#### Cognite Charts
The main new features in this Cognite Charts release are:
* Search for time series data by time series ID
* Highlights matches in search results
* Recently viewed tags and time series are displayed in the search panel
* Merge y-axes with the same units
* Show/hide min/max bands
* Show/hide gridlines
* Backend performance improvements
* Bug fixes & UI/UX improvements
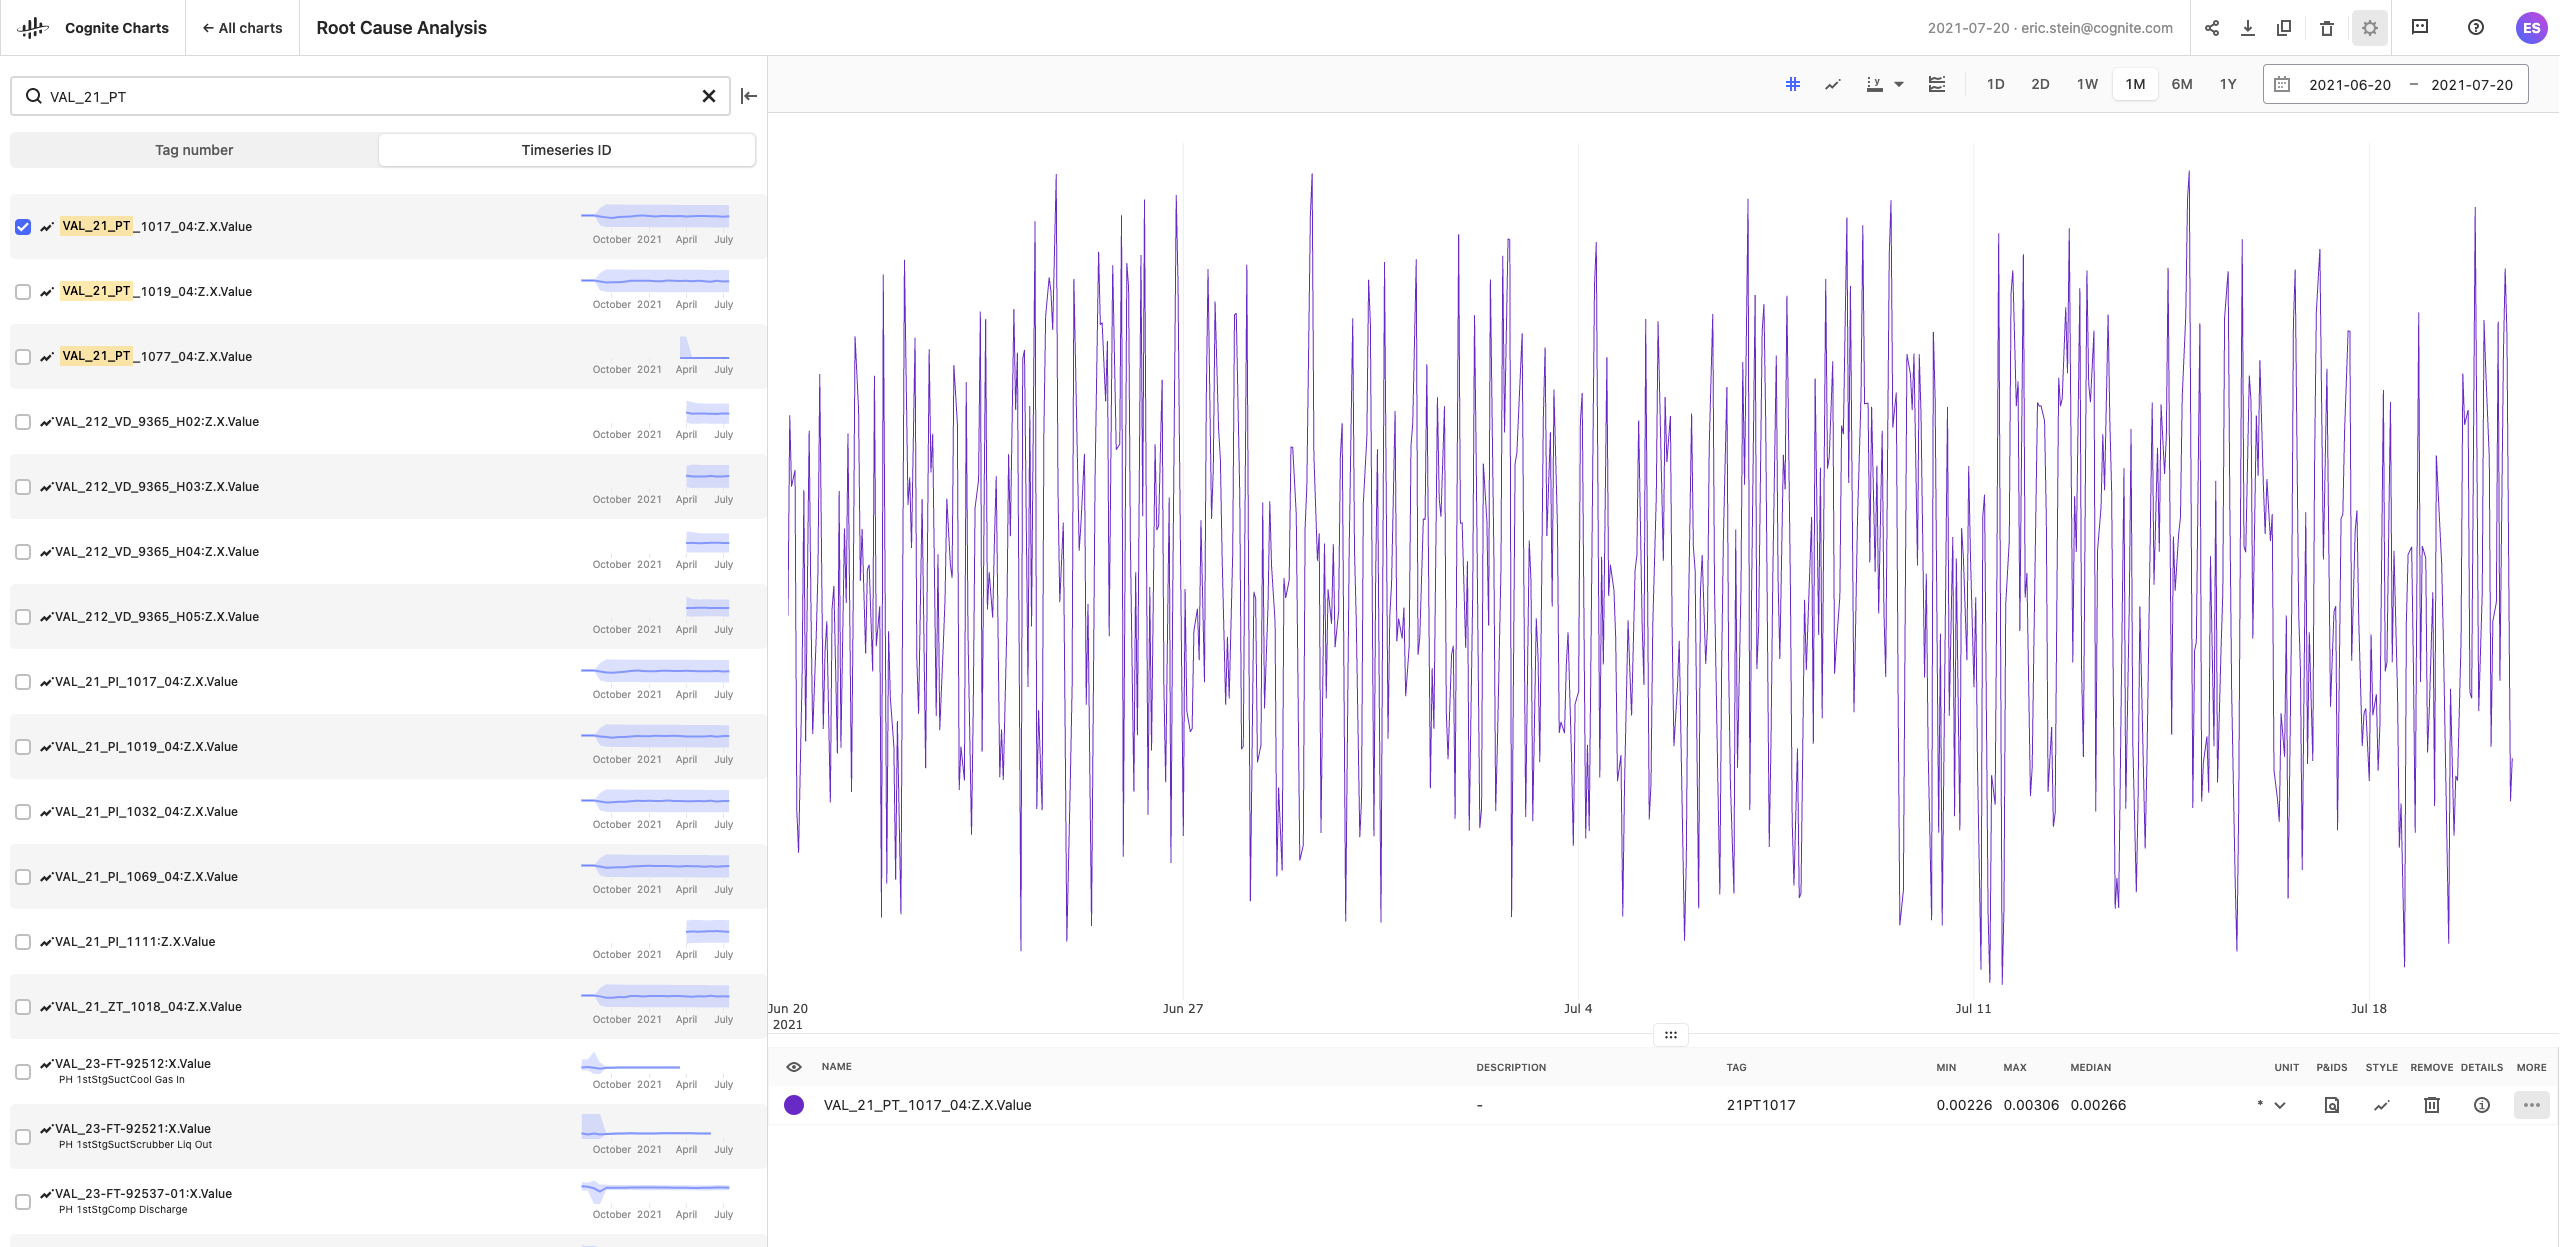
#### Search for time series data by time series ID
We have added a tab in the search panel to search for “Time series ID,†specifically. This tab should be used when you know the name of the *time series* you are searching for (e.g. `VAL_21_PT_1019_04:Z.X.Value`), while the “Tag number†tab should be used to search for the asset tag to which the time series of interest is related (e.g. `21PT1019`). You will also notice that search results that match your query are now highlighted to make direct matches easy to see.
If you're using the PostgreSQL gateway, you can add status reporting to your Azure Data Factory pipeline. If you prefer working more programmatically, the new version of the [Python Extractor Utils](https://cognite-extractor-utils.readthedocs-hosted.com/en/latest) allows building extractors with status reporting, or you can use the REST API or Python SDK. The Cognite Extractors support status reporting from our next release.
**Running SQL transformations using APIs and the Python SDK** significantly improves the developer experience as data engineers can manage transformations programmatically. Using the APIs/SDK, data engineers can orchestrate transformations sequentially, making it more reliable and quick. Check out the [API docs](/api-reference/concepts/20230101/api-description) and [SDK docs](https://cognite-sdk-experimental.readthedocs-hosted.com/en/latest/cognite.html#transformations) for more information. Note that the Transformations APIs and Python SDK are in public preview and will be promoted to V1 (production use) in November 2021.
**Data discovery by contextualizing engineering diagrams**, typically P\&IDs, has already shown its value in the market. In this release, we've redesigned and enhanced the **Create interactive engineering diagrams** process to give a delightful user experience. The new sidebar navigation guides you carefully through each step in finding, extracting, and matching tags and linking these to the asset hierarchy and other associated resource groups. New actions that **improve the quality** of the diagrams include approving and rejecting automatically detected tags, clearing all tags on a diagram, and better name-mapping and use of synonyms in tag detection. When you're done creating interactive diagrams, you can convert the approved PDF files to SVG if this is your preferred format. [Read the How-to guides](/cdf/integration/guides/contextualization/interactive_diagrams).
The **solution builders and data scientists** need transparent and easily accessible documentation and information about data science scripts and models to make correct and informed operational decisions. You'll find it all in the [Cognite Industrial Data Science Library](https://indsl.docs.cognite.com).
Industrial data analytics must be of high quality and **Cognite Charts** is focused on the nitty-gritty details and to give you a smooth charting experience. You'll find **function descriptions** by selecting the Information icon located next to a function. Notice also that **named inputs/outputs** in Cognite Charts make it clear to see which are required for a function. When you zoom in to a specific point on a time series, the aggregated values automatically switch to showing the **raw data**. In addition, **all** measurement units stored on time series in CDF are now displayed in Cognite Charts.
For the **solution builders**, we've enabled **client credentials grant flow in Grafana**. In some cases, for example, if you're using the Grafana free tier, you can not set up an identity provider for the whole Grafana instance. Instead, you need to set up a client credentials grant flow for each instance of the Cognite Data Source. You'll find all the information you need to set this up in [this article](/cdf/dashboards/guides/grafana/admin_oidc#set-up-a-client-credentials-grant-flow).
For the **CDF administrators**, we're introducing a new **token session service** for managing internal sessions and exposing internal and external endpoints for interacting with them. The token session API service allows users and service principals outside the API to run jobs within the API. External principals can use the sessions API to delegate their access to functionality in CDF. You can use this functionality to set up and manage long-lived or timed access for internal services. The access is rooted in the respective principal's external identity provider (IdP), from where it can be controlled or terminated. For example, a user can specify a function to be run on their behalf and terminated if their user account is deleted.
Today, we are happy to announce the release of the following improvements to Cognite Data Fusion (CDF).
#### Manage RAW foreign table in the Postgres Gateway
You can now manage the RAW foreign table in the Postgres Gateway using APIs and don't have to rely on external tools such as pgAdmin or psql CLI to create, list, update or delete the RAW foreign tables.
#### Update labels on assets
To make it easier to update labels on assets, we have added a set method in the [updateAssets operation](/api-reference/concepts/20230101/assets). The operation accepts a list of labels to set or replace for the resource.
#### Update sequence configuration
With the availability of [mutable sequences](/api-reference/concepts/20230101/sequences), you can now update an existing sequence configuration. In addition to adding, removing and updating columns in your sequence, you can also update or clear the assetId, externalId, metadata, and the dataSetId for a sequence. To update a sequence, you need `sequencesAcl:WRITE` capabilities.
#### Group limits
To support authentication for users who are members of a **large number of Azure AD groups** we have increased the default group limit token configuration to 1.000 for new CDF projects with AAD as the IdP from now on.
#### Interactive engineering diagrams
We're hard at work putting the final touches on our new user experience for working with interactive engineering diagrams. Stay tuned for the upcoming release.
#### Cognite Charts
The main new features in this Cognite Charts release are:
* Search for time series data by time series ID
* Highlights matches in search results
* Recently viewed tags and time series are displayed in the search panel
* Merge y-axes with the same units
* Show/hide min/max bands
* Show/hide gridlines
* Backend performance improvements
* Bug fixes & UI/UX improvements
#### Search for time series data by time series ID
We have added a tab in the search panel to search for “Time series ID,†specifically. This tab should be used when you know the name of the *time series* you are searching for (e.g. `VAL_21_PT_1019_04:Z.X.Value`), while the “Tag number†tab should be used to search for the asset tag to which the time series of interest is related (e.g. `21PT1019`). You will also notice that search results that match your query are now highlighted to make direct matches easy to see.
 You'll also see the tags (assets) and time series you have recently viewed (added and/or removed from your chart) in the search panel, if you have not begun to type a search query.
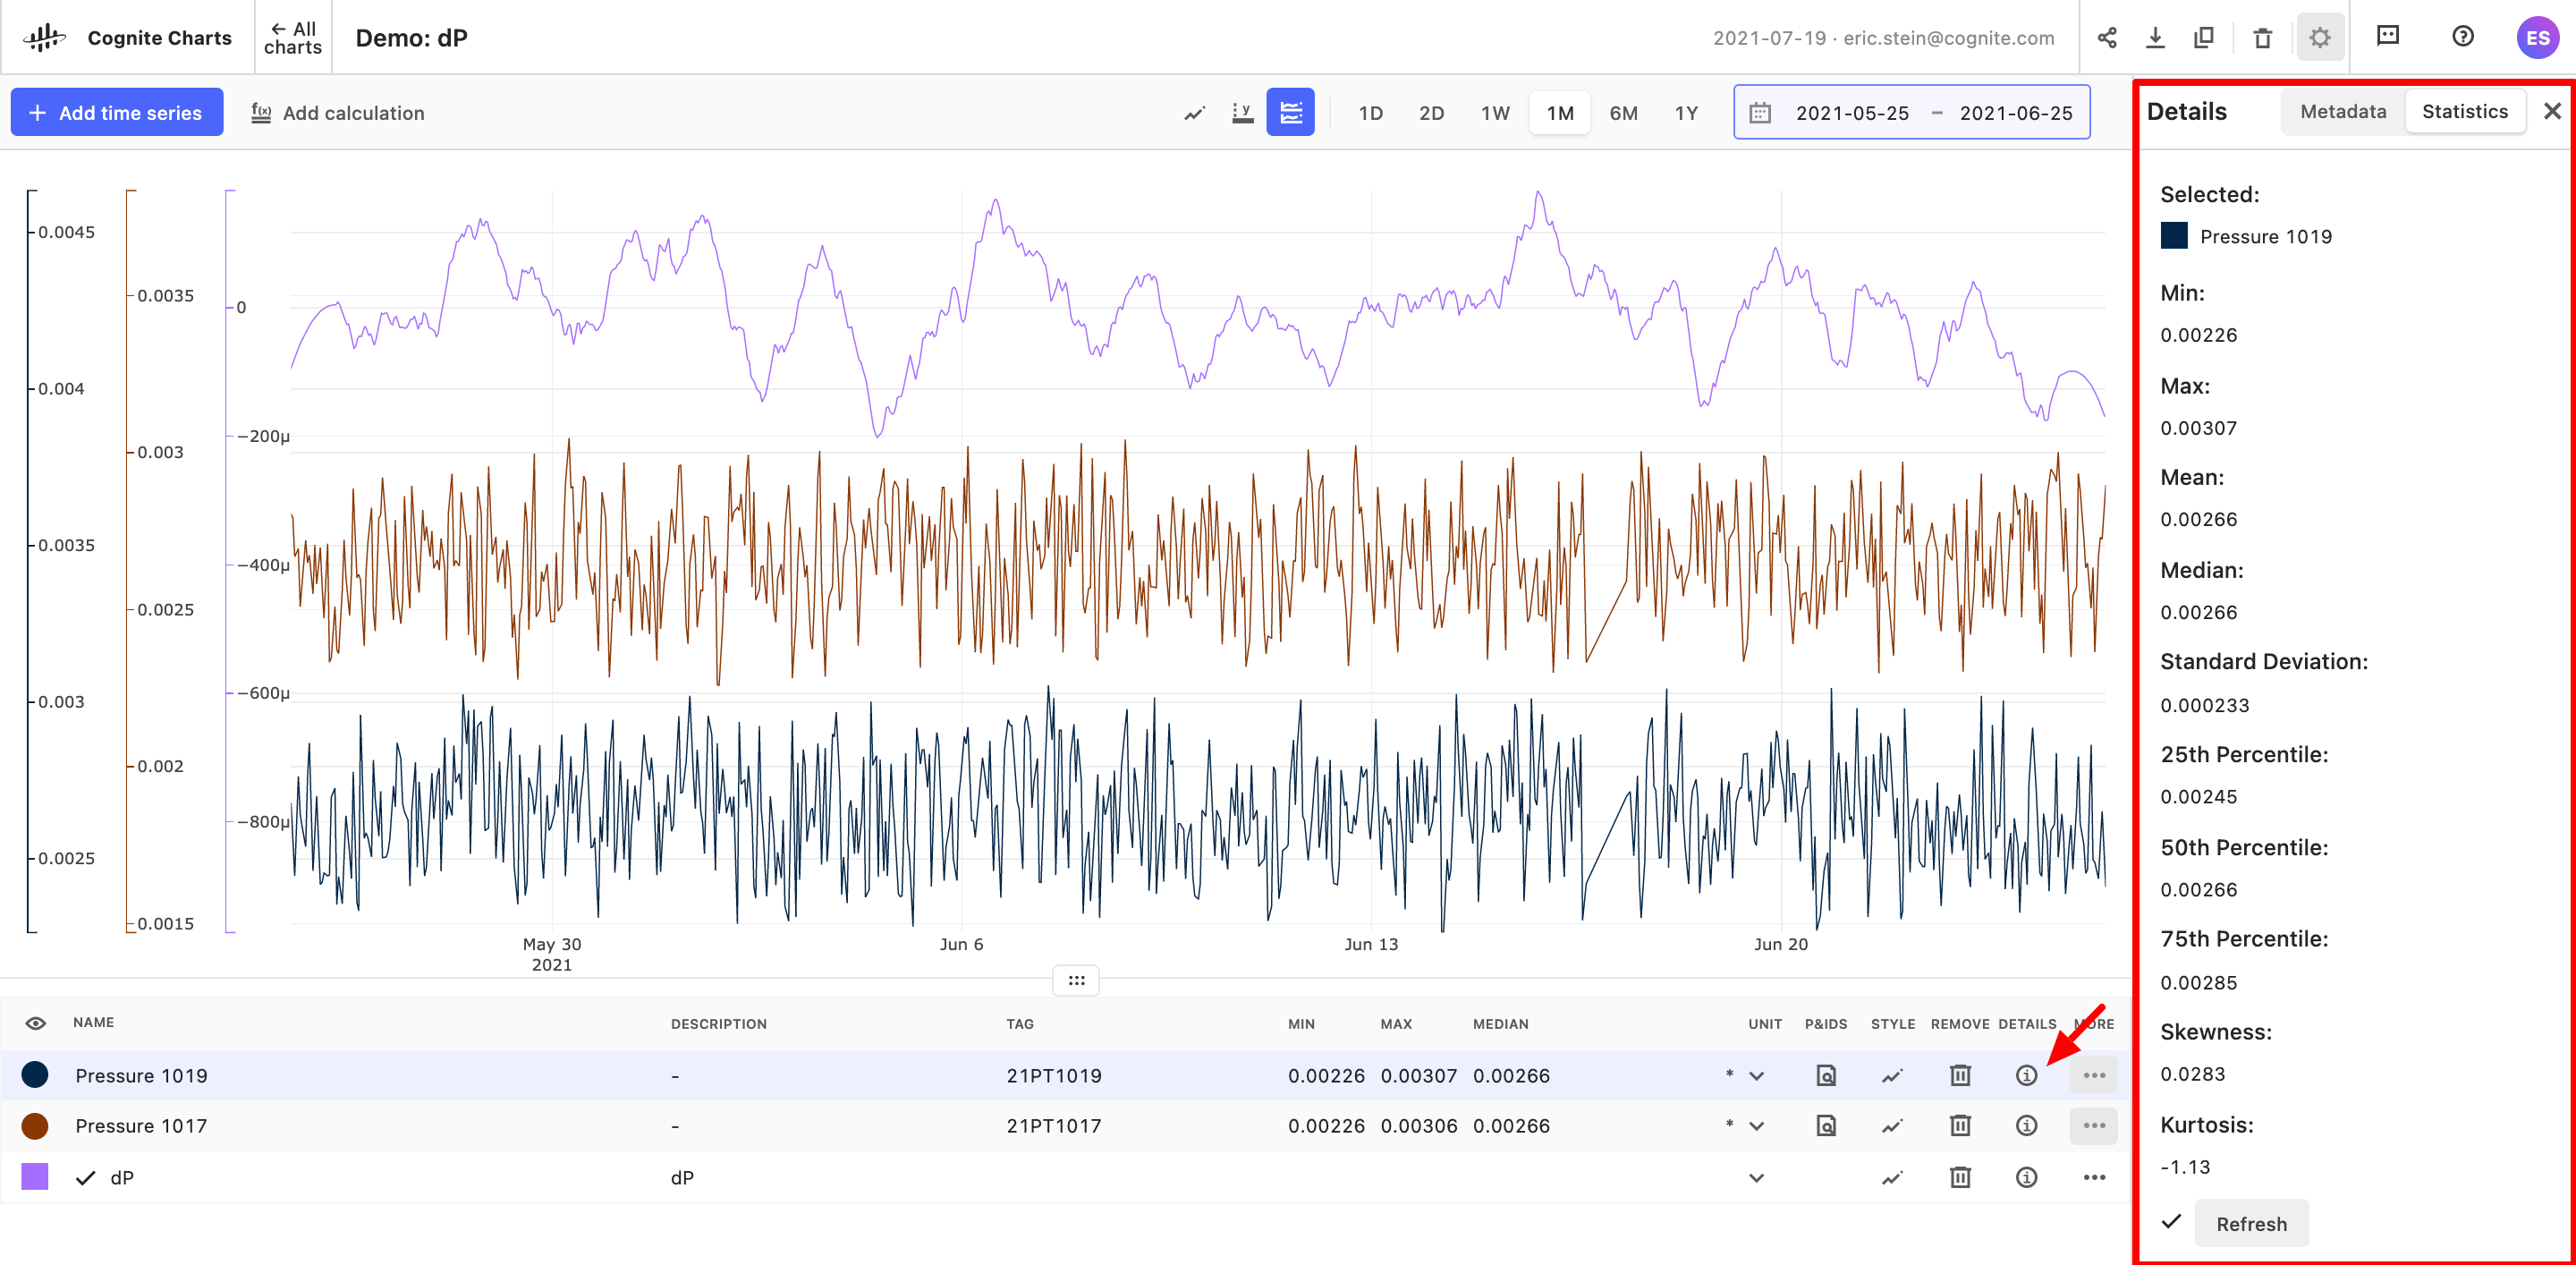
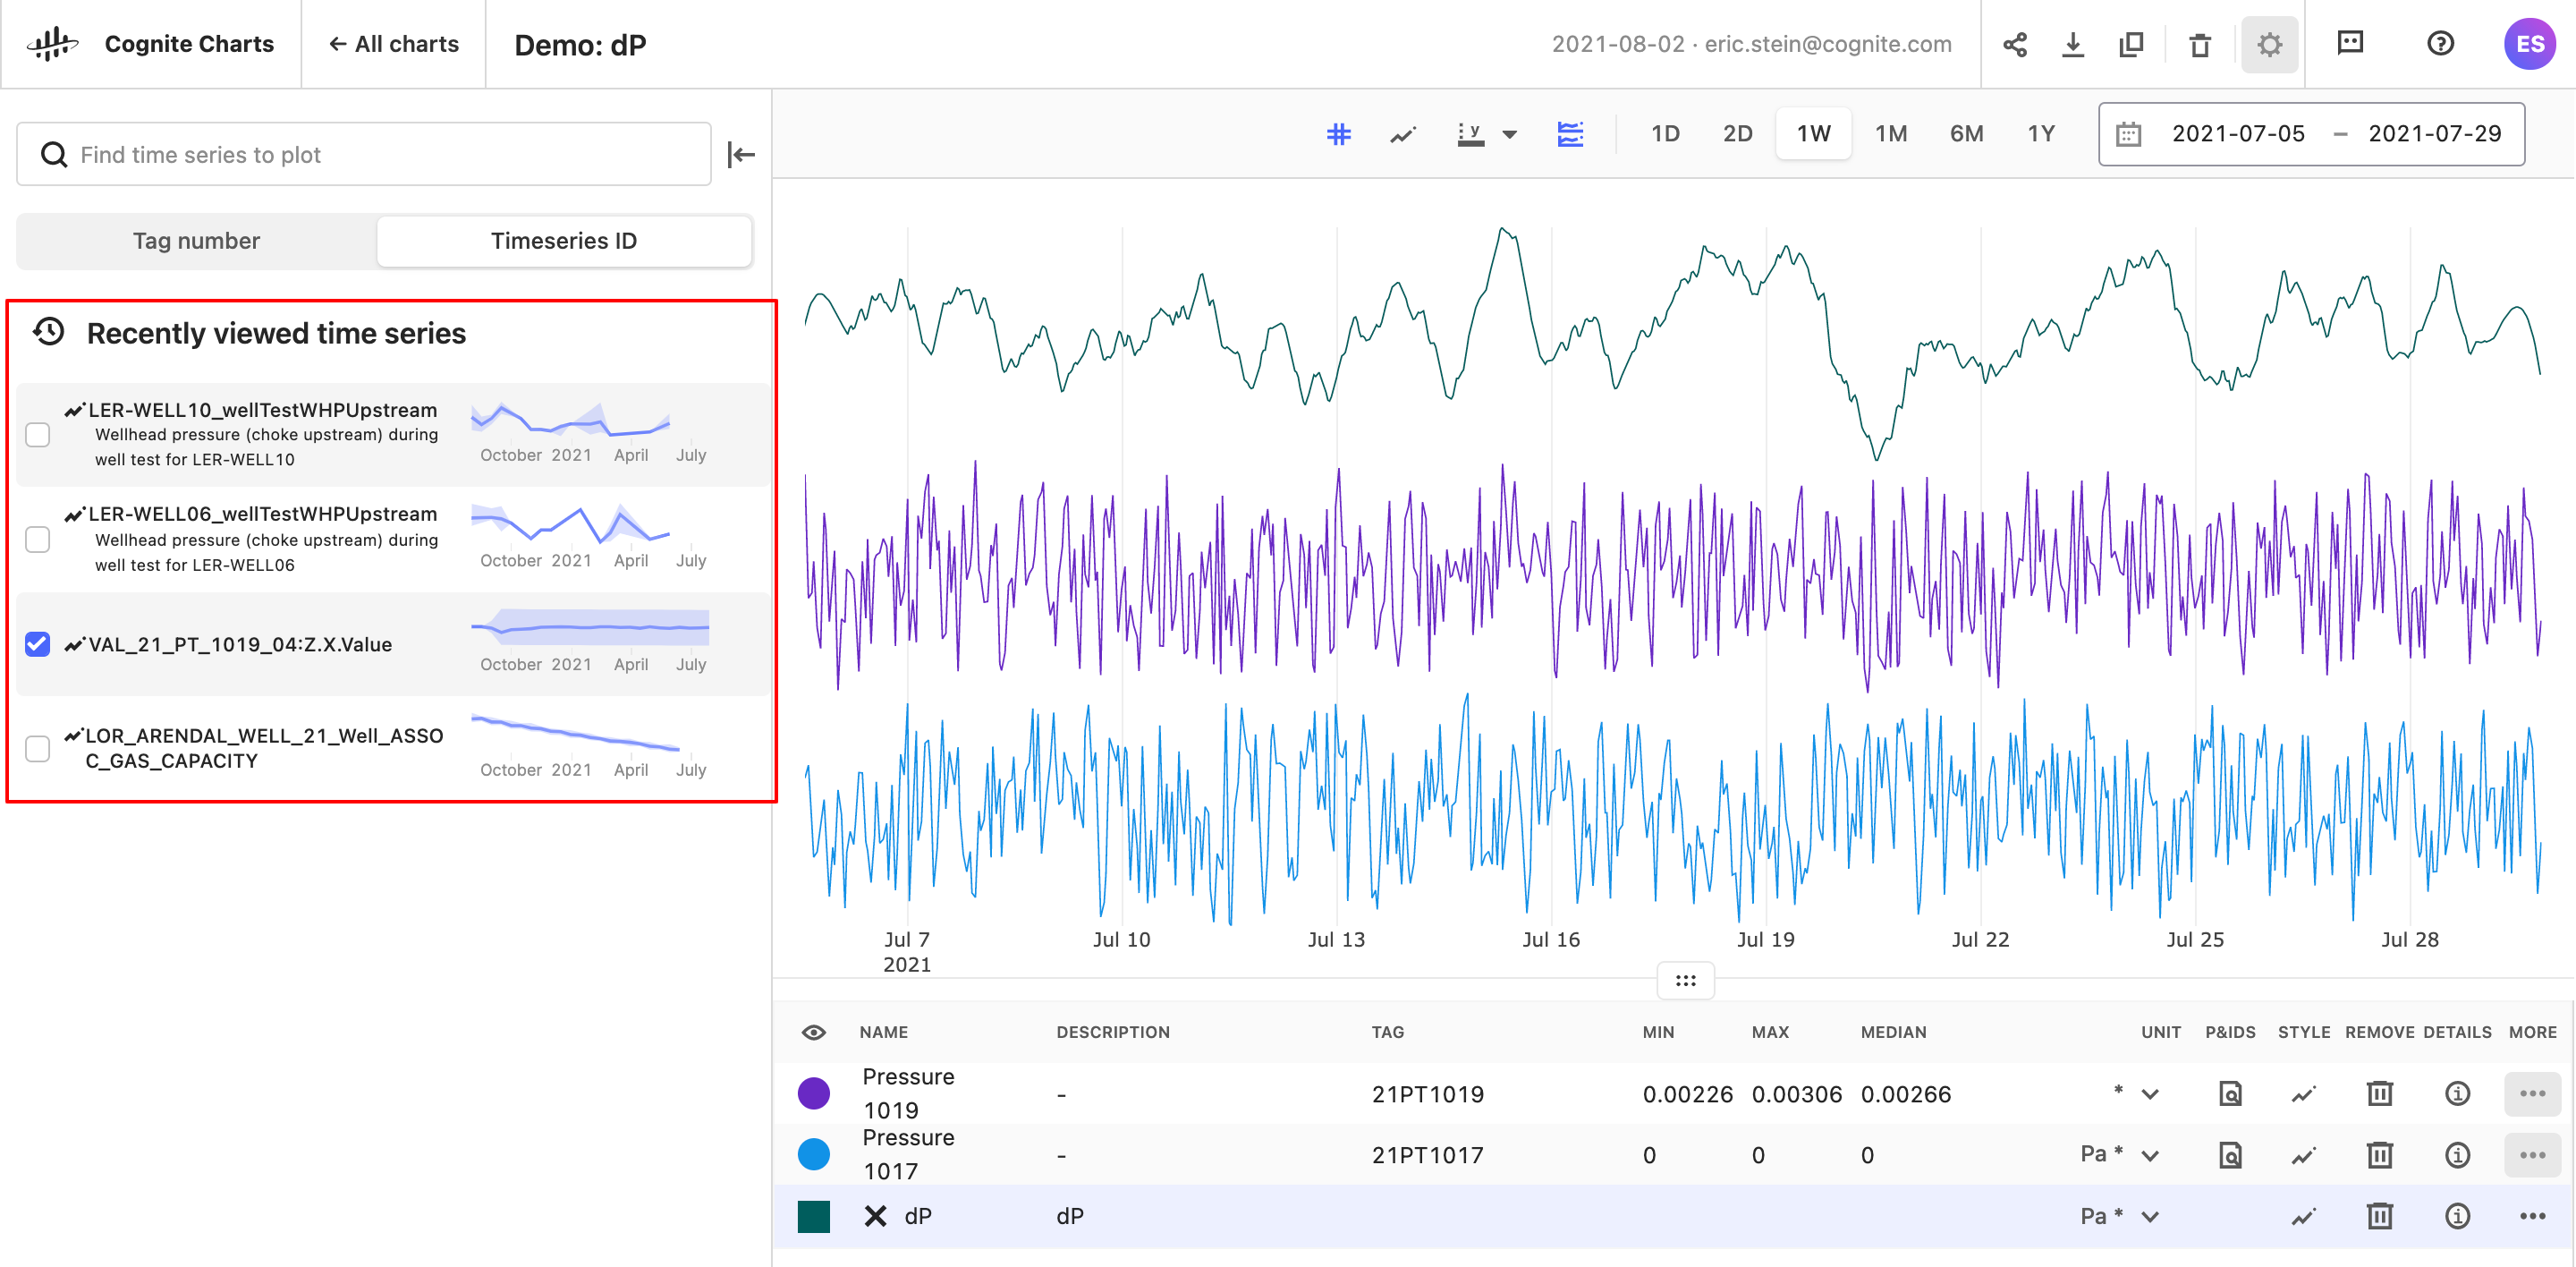 #### Basic Statistics & Tag Metadata
Users can view additional basic statistics (mean, std. dev., etc.) for the a given time series for the time range they're currently viewing in the chart by selecting the corresponding information icon. By selecting the “Metadata†tab in this panel on the right-hand side of the screen, can view the metadata information.
#### Basic Statistics & Tag Metadata
Users can view additional basic statistics (mean, std. dev., etc.) for the a given time series for the time range they're currently viewing in the chart by selecting the corresponding information icon. By selecting the “Metadata†tab in this panel on the right-hand side of the screen, can view the metadata information.
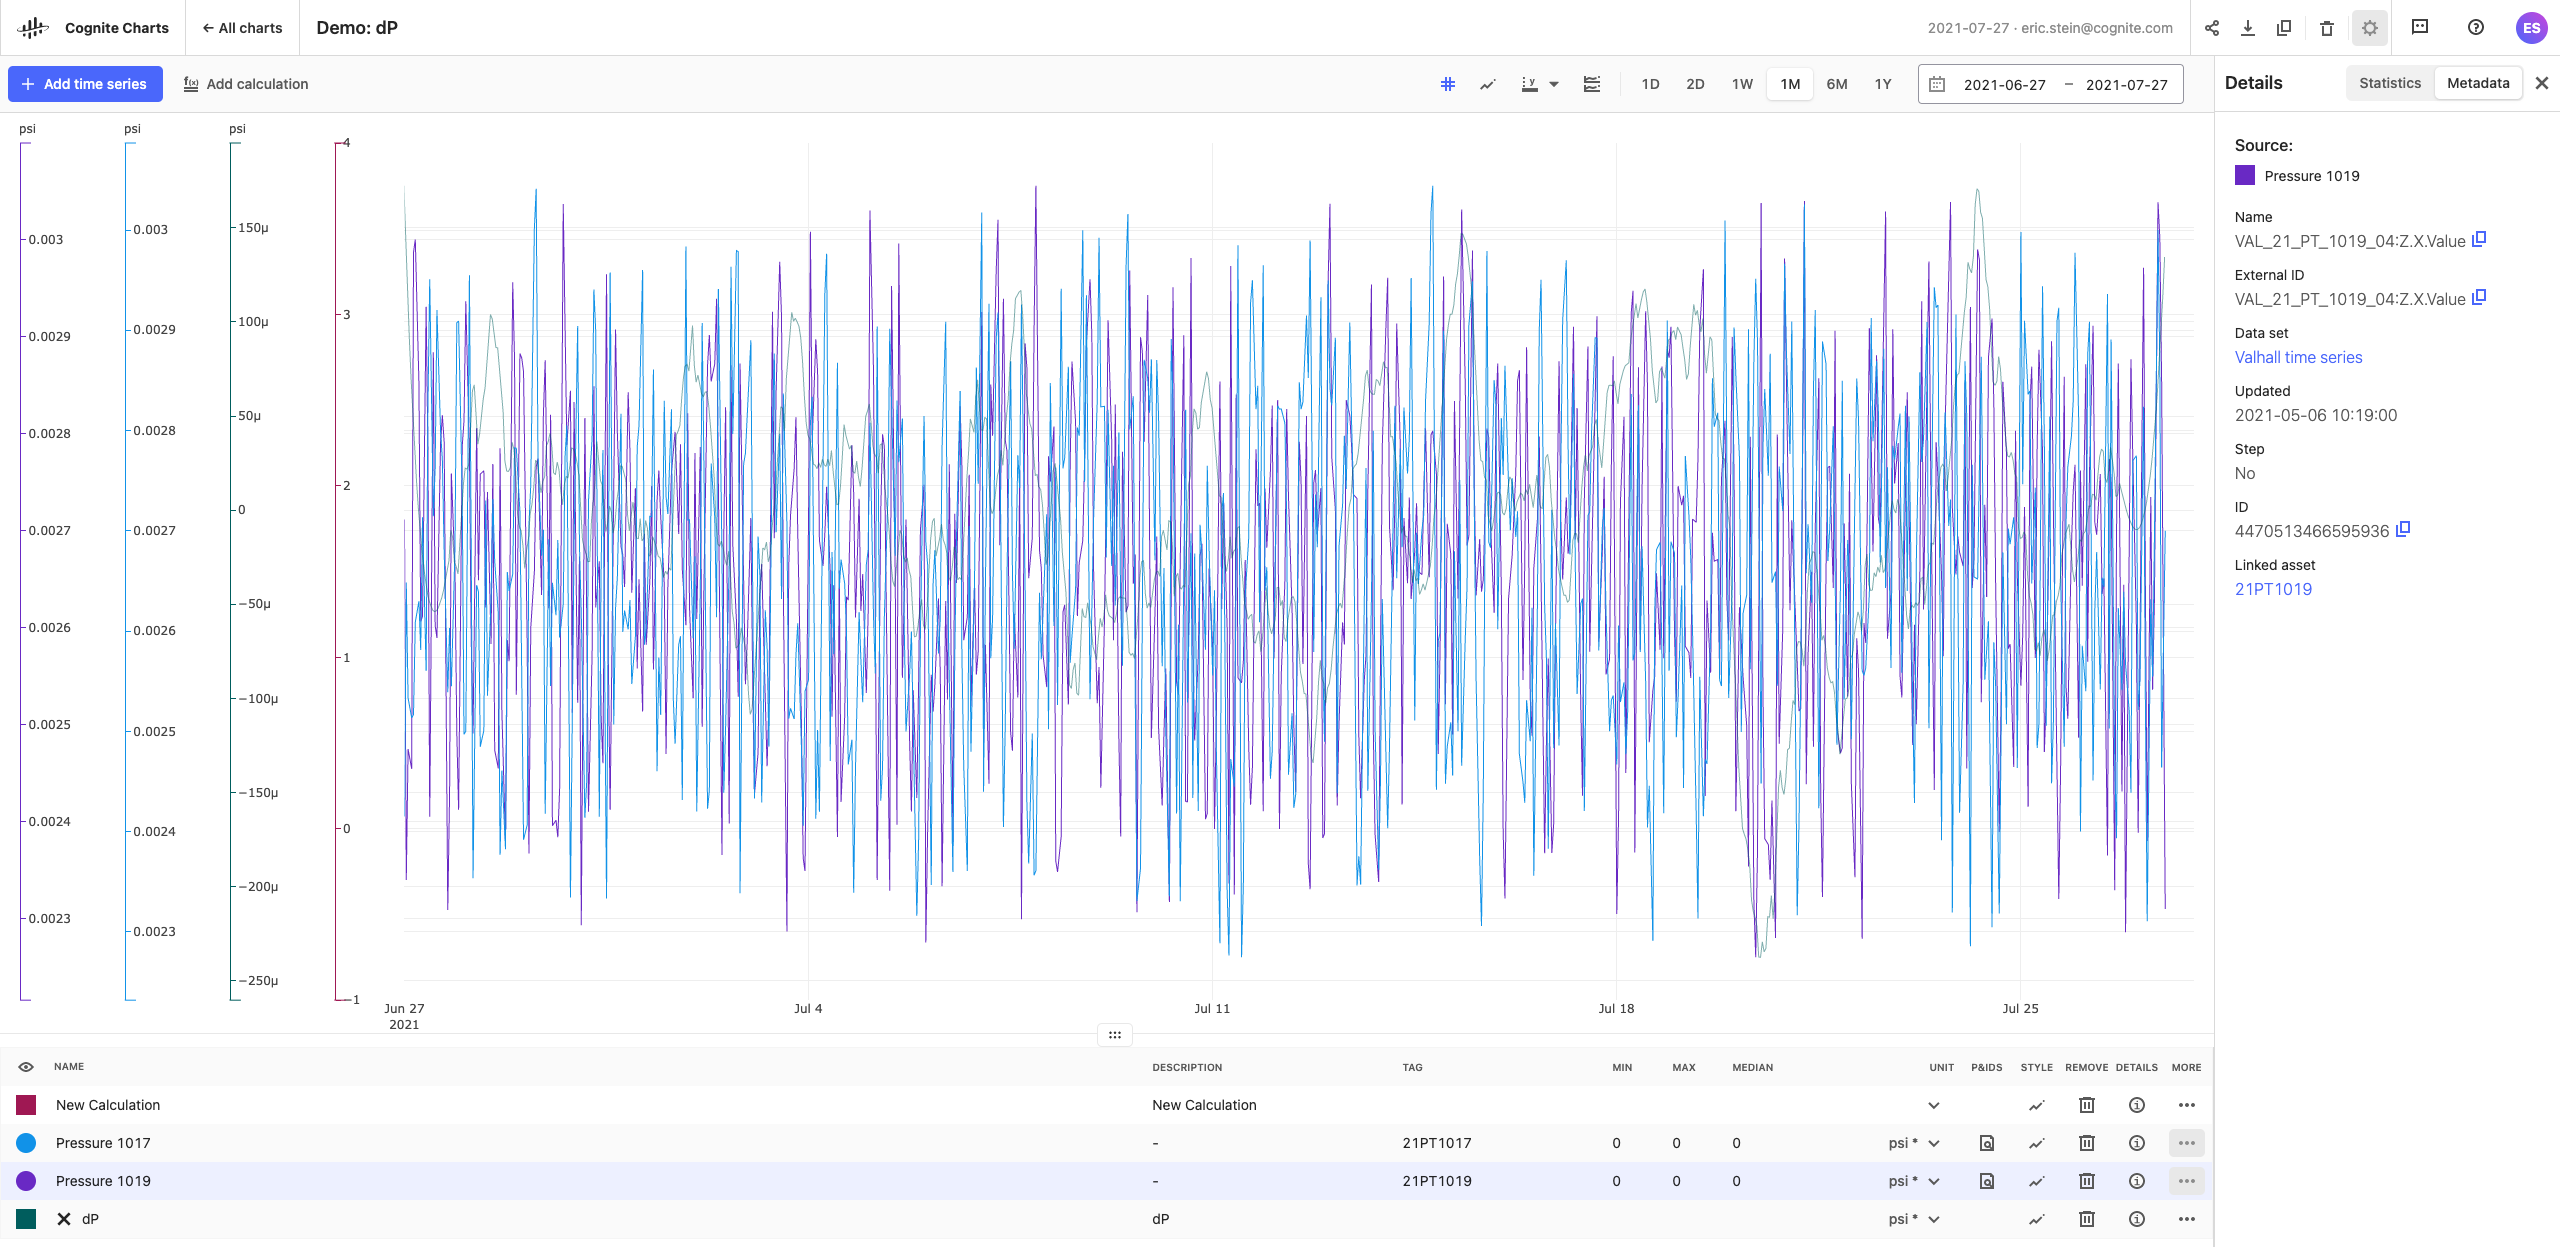 #### Merge y-axes with same units
It's now possible to easily compare the values of two or more time series or calculations that have the same unit, without needing to manually match and align the axes individually. Simply select the y-axis button found just above your chart and select the “Merge units†toggle. In order for this feature to work, you must have already assigned the input and output units on the time series or calculation(s) of interest.
#### Merge y-axes with same units
It's now possible to easily compare the values of two or more time series or calculations that have the same unit, without needing to manually match and align the axes individually. Simply select the y-axis button found just above your chart and select the “Merge units†toggle. In order for this feature to work, you must have already assigned the input and output units on the time series or calculation(s) of interest.
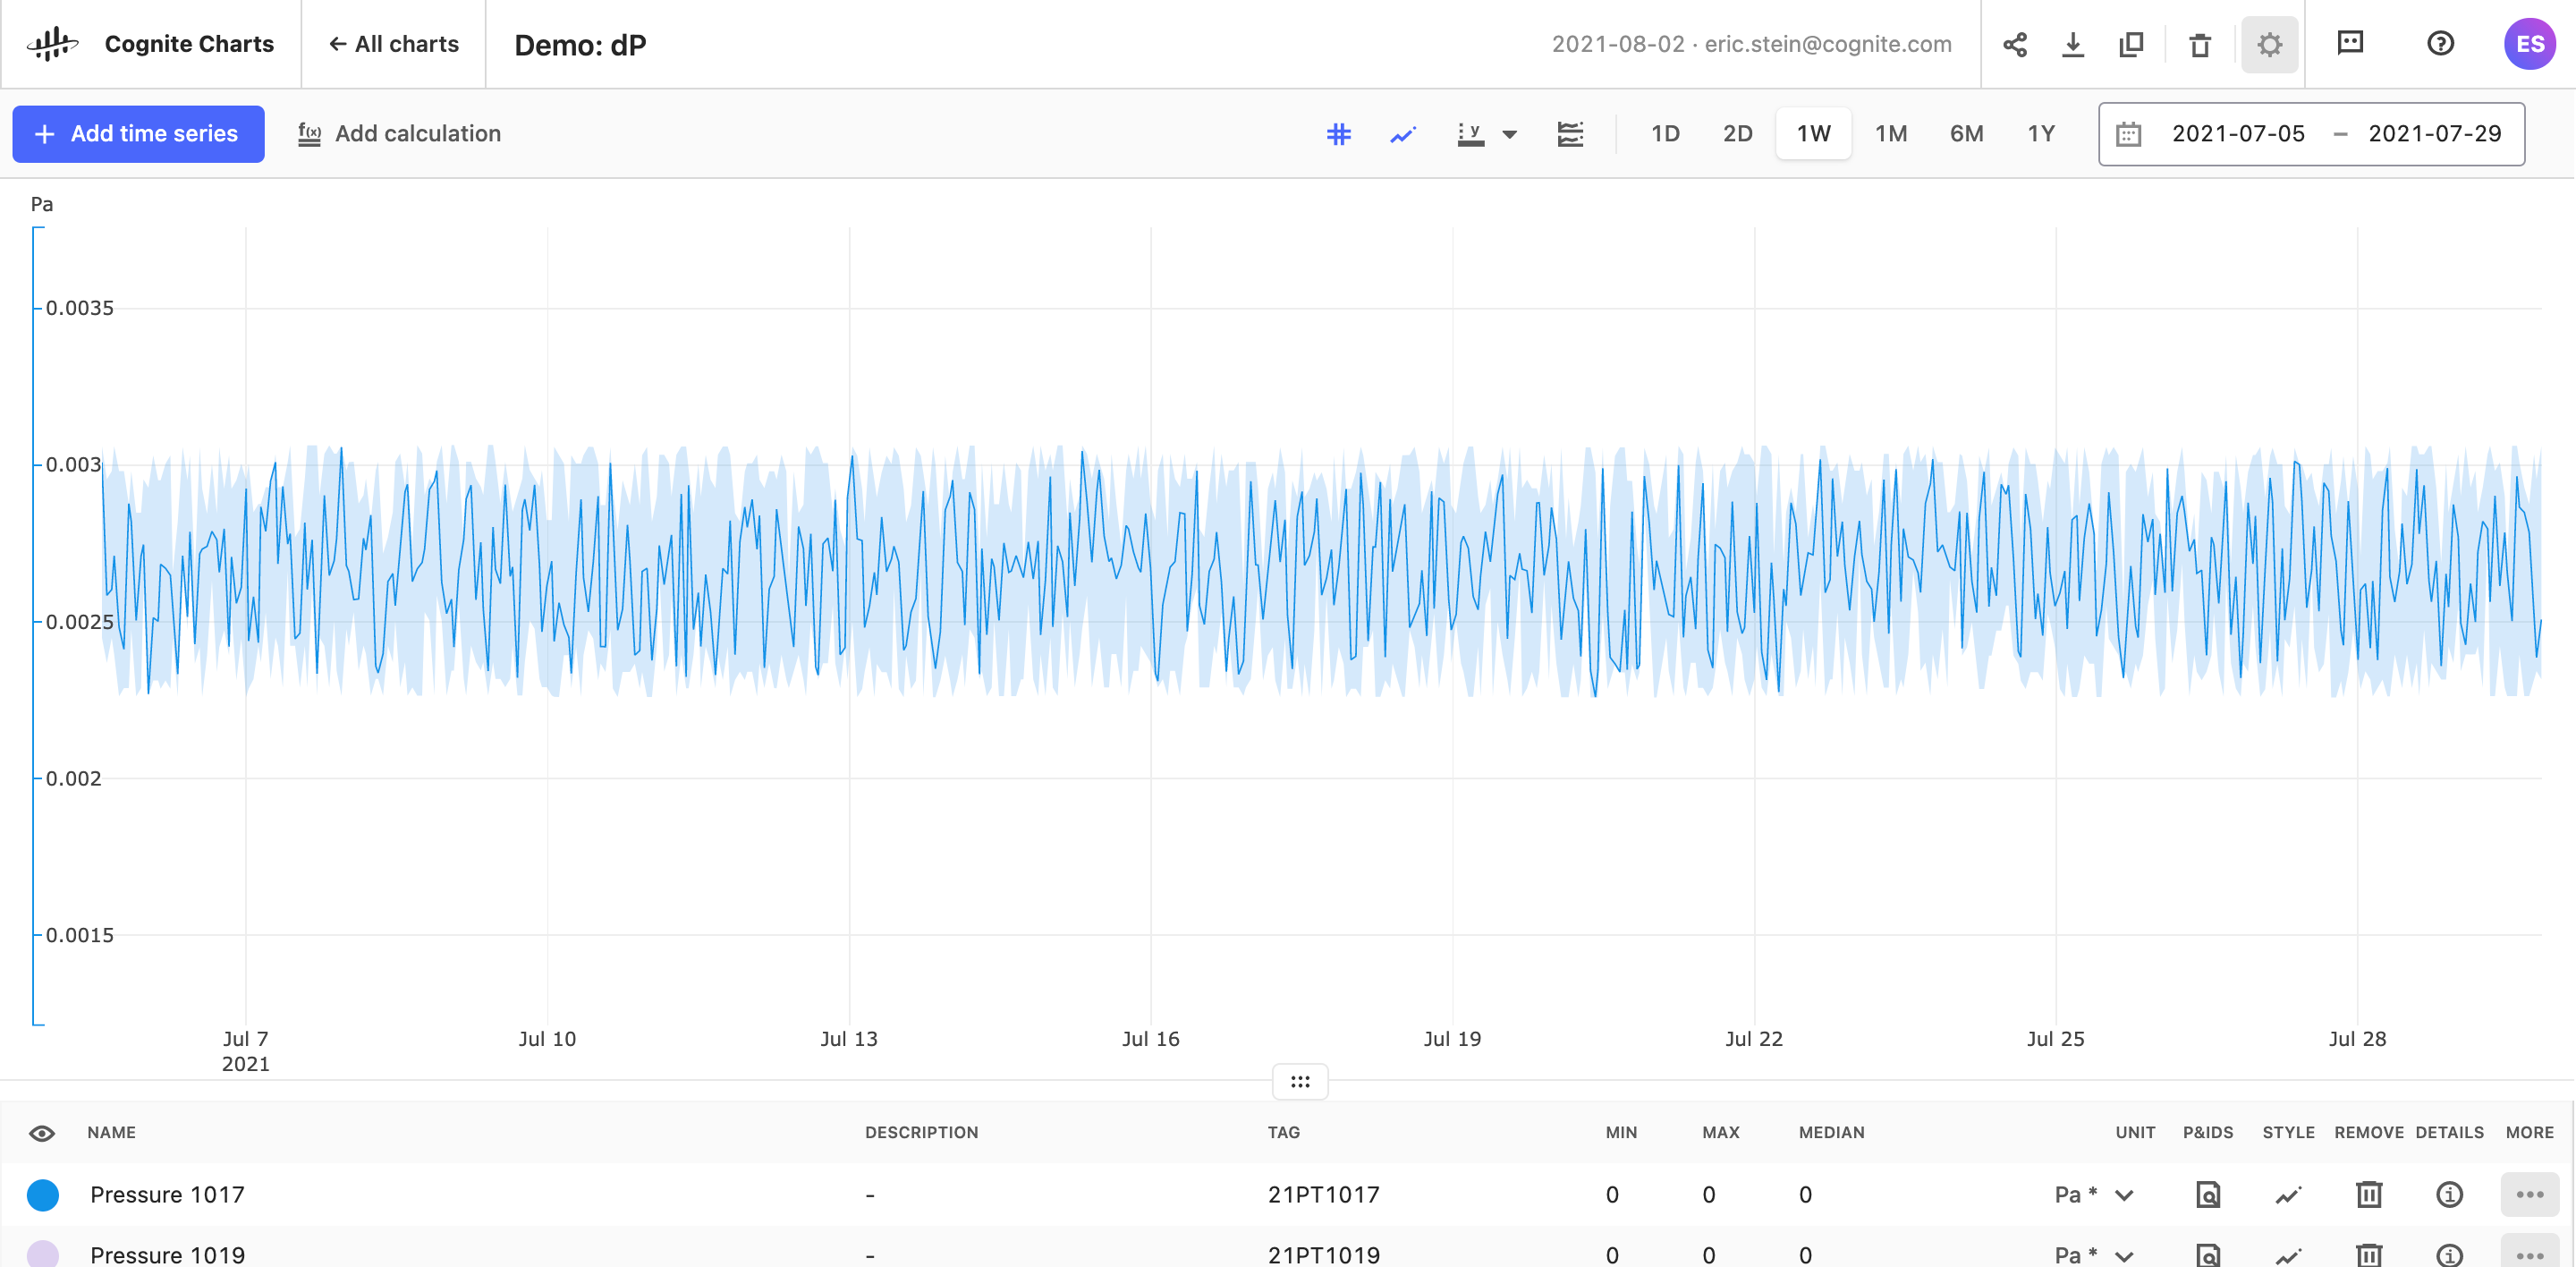
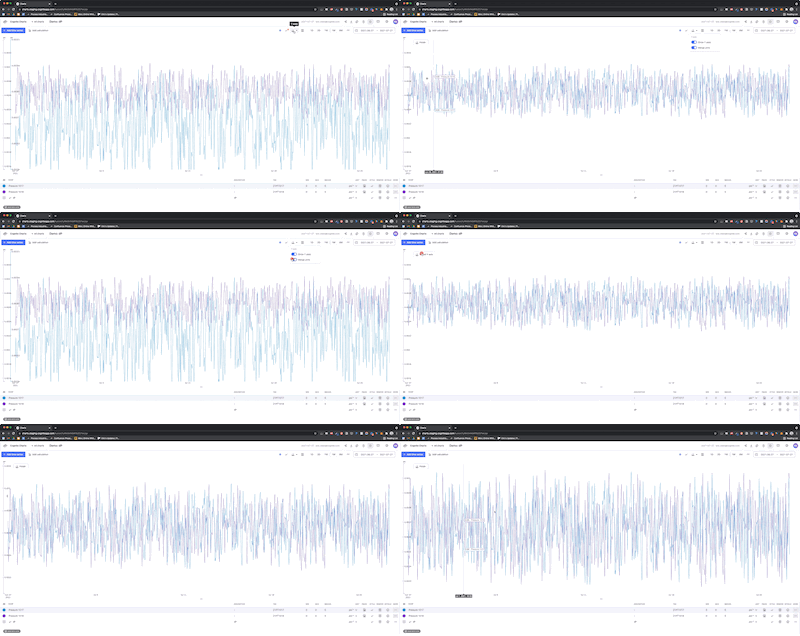 #### Show/hide min/max bands
While looking at a wider range of time, Charts will show the aggregated values for a given time series. With the min/max bands, it's possible to visually display the min and max range for a time series.
#### Show/hide min/max bands
While looking at a wider range of time, Charts will show the aggregated values for a given time series. With the min/max bands, it's possible to visually display the min and max range for a time series.
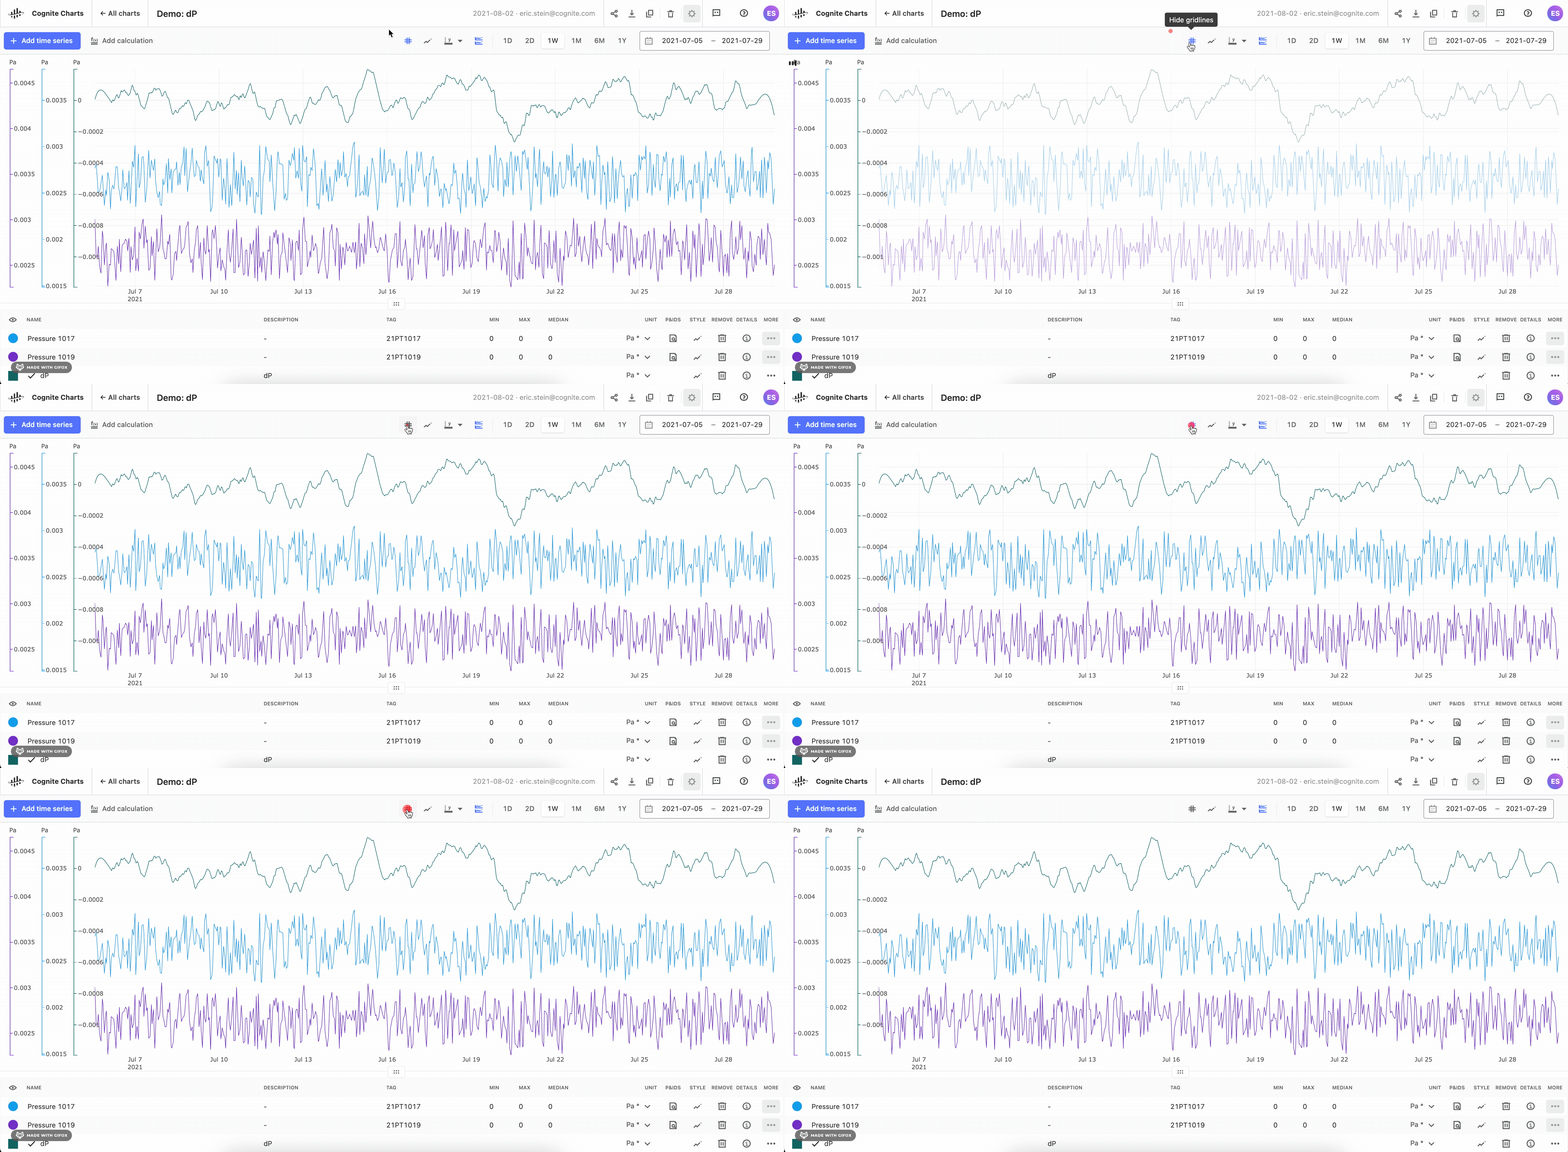
 #### Show/hide gridlines
Gridlines can be a valuable way to visually identify time series values, but they could also get in the way and be confusing when you have a lot of time series data on your Chart. Use the show/hide gridlines toggle to decide for yourself whether or not you want them displayed on your chart.
#### Show/hide gridlines
Gridlines can be a valuable way to visually identify time series values, but they could also get in the way and be confusing when you have a lot of time series data on your Chart. Use the show/hide gridlines toggle to decide for yourself whether or not you want them displayed on your chart.
 In his release we are adding a PostgreSQL gateway to stream data into CDF from your existing ETL solutions or push data directly to the gateway from extractors that support Postgres.
#### CDF Transformations now support OpenID Connect
In his release we are adding a PostgreSQL gateway to stream data into CDF from your existing ETL solutions or push data directly to the gateway from extractors that support Postgres.
#### CDF Transformations now support OpenID Connect
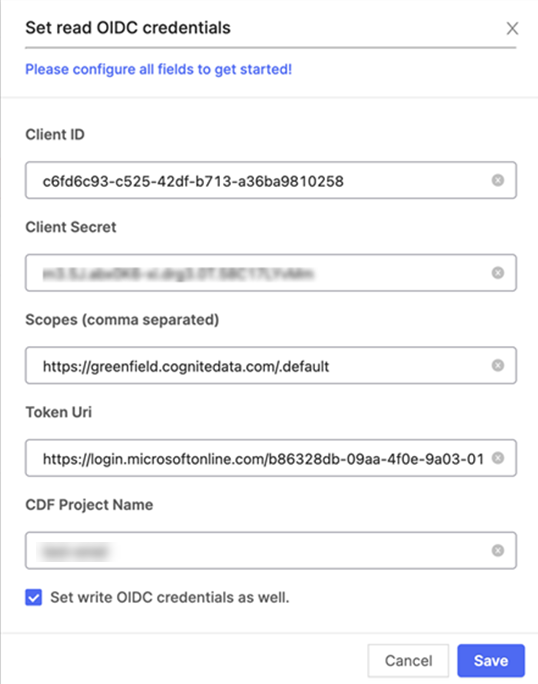 You can now use OpenID Connect and your existing identity provider (IdP) framework to manage access to **CDF Transformations** securely. We currently support Azure AD, Microsoft's cloud-based identity and access management service.
When you have registered **CDF Transformations** in Azure AD, users can sign in with their organizational ID to transform data in a CDF project.
You can update existing transformations that are currently using API keys to use OIDC client credentials instead.
**NOTE**: CDF projects running in Google Cloud Platform need to be added to an allowlist (sometimes called a *whitelist*) to support scheduling of transformations using OpenID Connect. Contact your Cognite representative to be added to the allowlist.
**Learn more** in [Setup and administration with OpenID Connect](/cdf/integration/guides/transformation/admin_oidc).
#### PostgreSQL gateway
Use the **PostgreSQL** gateway to ingest data into CDF from popular ETL solutions. The CDF resource types appear as tables in the PostgreSQL database and you can ingest data directly into CDF resources like assets, events and datapoints and to Cognite RAW.
* We currently support Azure Data Factory as the ETL tool.
* The PostgreSQL Gateway is intended for ingestion only. We do not support querying data from CDF using the gateway.
#### Grafana - nested variables
In Grafana, you can now link variables and use the value of one variable as input to another.
You can now use OpenID Connect and your existing identity provider (IdP) framework to manage access to **CDF Transformations** securely. We currently support Azure AD, Microsoft's cloud-based identity and access management service.
When you have registered **CDF Transformations** in Azure AD, users can sign in with their organizational ID to transform data in a CDF project.
You can update existing transformations that are currently using API keys to use OIDC client credentials instead.
**NOTE**: CDF projects running in Google Cloud Platform need to be added to an allowlist (sometimes called a *whitelist*) to support scheduling of transformations using OpenID Connect. Contact your Cognite representative to be added to the allowlist.
**Learn more** in [Setup and administration with OpenID Connect](/cdf/integration/guides/transformation/admin_oidc).
#### PostgreSQL gateway
Use the **PostgreSQL** gateway to ingest data into CDF from popular ETL solutions. The CDF resource types appear as tables in the PostgreSQL database and you can ingest data directly into CDF resources like assets, events and datapoints and to Cognite RAW.
* We currently support Azure Data Factory as the ETL tool.
* The PostgreSQL Gateway is intended for ingestion only. We do not support querying data from CDF using the gateway.
#### Grafana - nested variables
In Grafana, you can now link variables and use the value of one variable as input to another.
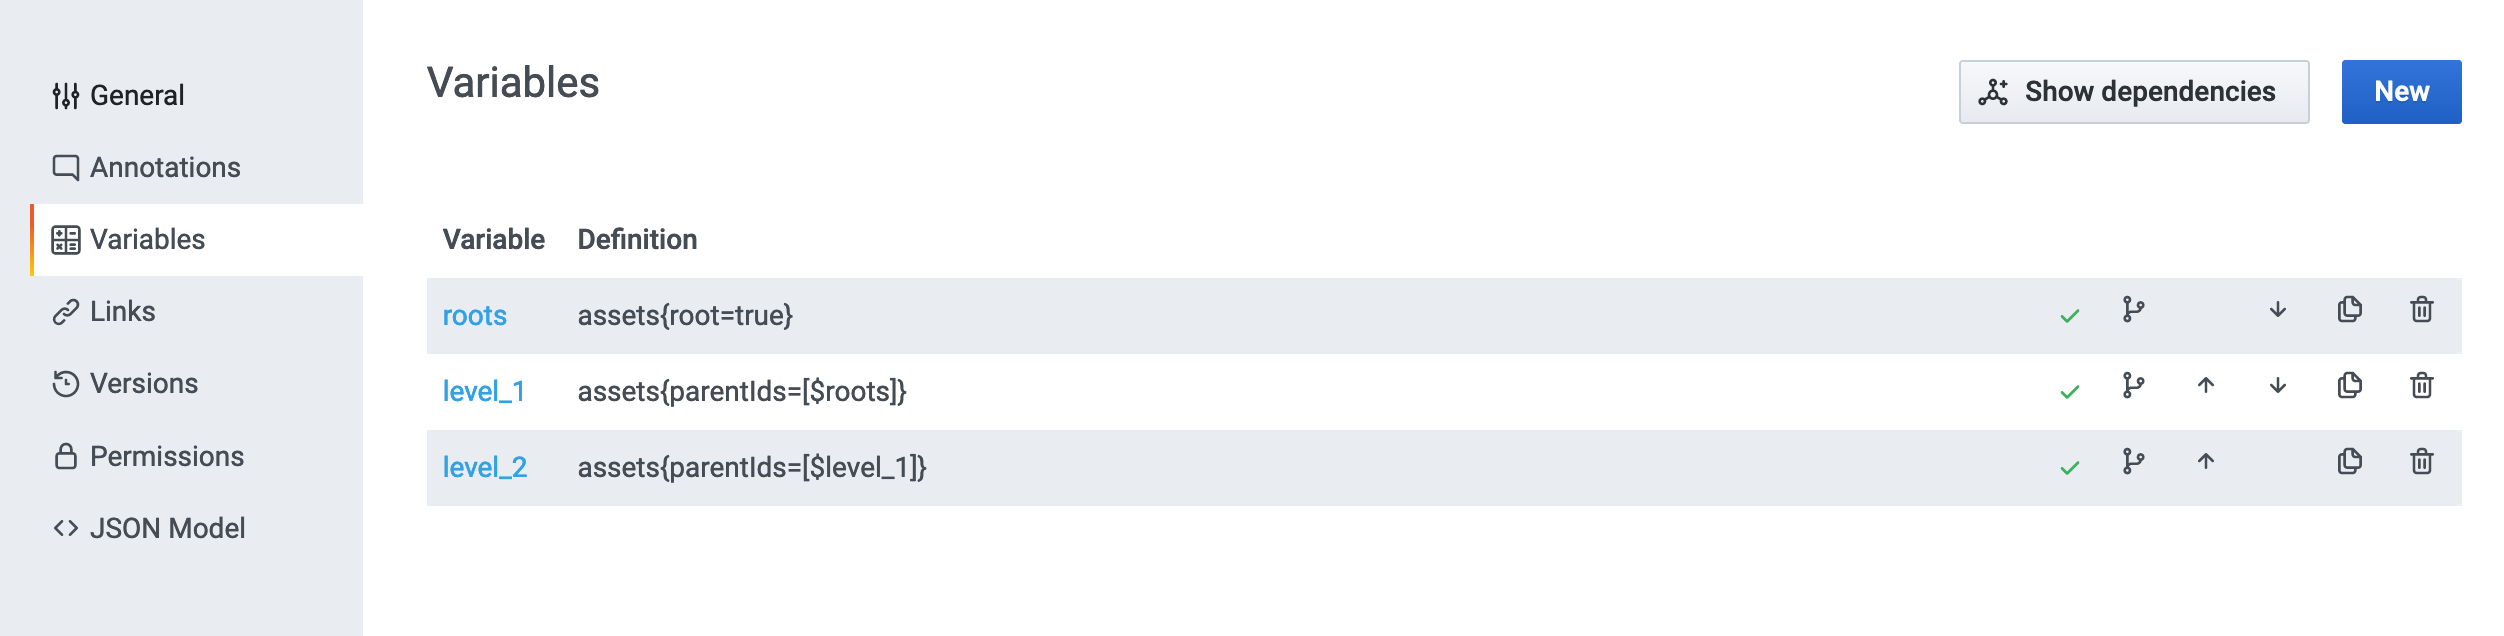 **Learn more**: [Nested (chained) variables](/cdf/dashboards/guides/grafana/variables#nested-chained-variables)
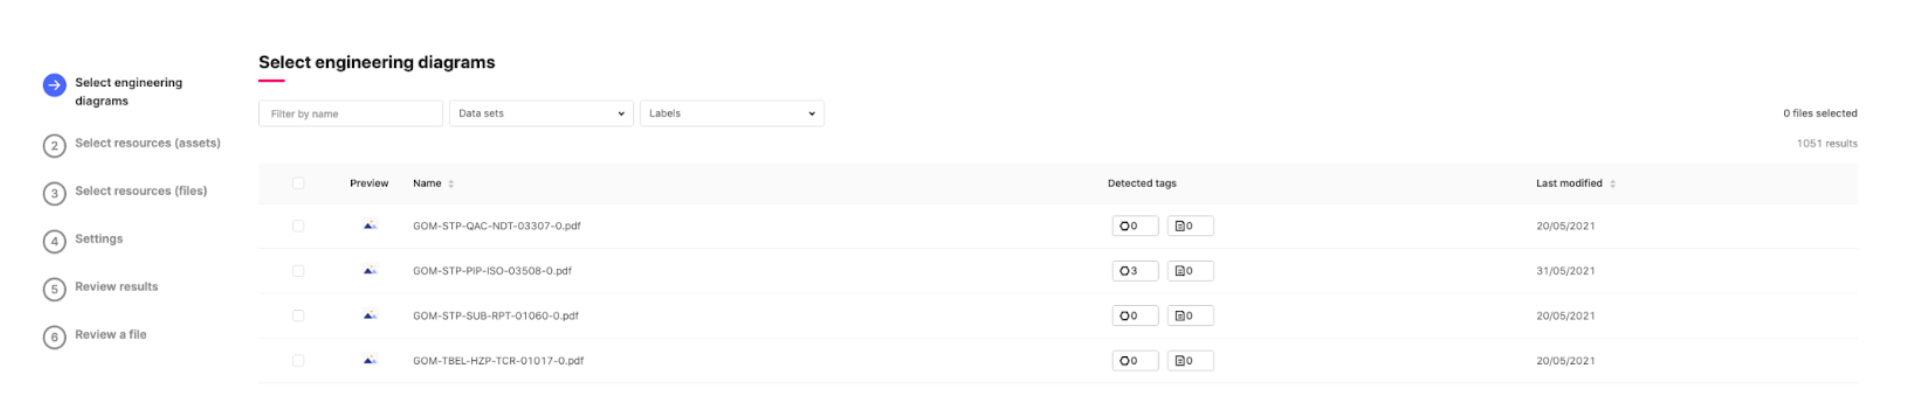
#### Sneak peek at the new interactive diagrams experience
We're excited to give you a sneak peek of the latest redesign and enhancements to the interactive diagrams experience before it's released publicly.
**Learn more**: [Nested (chained) variables](/cdf/dashboards/guides/grafana/variables#nested-chained-variables)
#### Sneak peek at the new interactive diagrams experience
We're excited to give you a sneak peek of the latest redesign and enhancements to the interactive diagrams experience before it's released publicly.
 #### Power BI - templates
We have added support for Templates in Power BI to early adopters. Contact your Cognite representative to give it a try and share your feedback!
This release of Cognite Data Fusion (CDF) focuses on the end-to-end data journey with fast and secure authentication to all Cognite applications using your organization's IdP. We currently support Microsoft'sAzure Active Directory (Azure AD). Speed up the time spent getting value for operations using a new sample function for contextualization and add events to a Grafana dashboard for visualizing and analyzing your CDF data.
#### Manage access with OpenID Connect
Register the CDF portal application and other Cognite applications in your IdP (Identity Provider) and use **OpenID Connect** and your **IdP framework** to manage **user** and **service principal** (app) identities securely. We currently support Microsoft's **Azure Active Directory (Azure AD)**.
:::info NOTE
With the introduction of OpenID Connect and the IdP framework to manage CDF access securely, we strongly encourage customers to adopt the new authentication flows as soon as possible.
:::
#### SQL Transformations CLI and Cognite Extractors support OpenID Connect authentication
Transformations CLI users, scheduled transformation jobs, and Cognite extractors can now authenticate using OpenID Connect and Azure AD.
#### Accelerate data set contextualization
Speed up your contextualization with the `entity_matching.suggest.fields` function. Supply the function with data samples to return suggested fields you can use for entity matching in the API, SDK, or UI.
Use existing matches to automatically generate matching rules to apply to all your data.
Add input naming variations to the entity matching model to improve the suggested matches, for example, *pmp* for *pump* and *bhp* for *bottom hole pressure*. To create a list of synonyms, use `replacements` in the API.
#### Visualize, track, and analyze events in Grafana
Boost your insights by adding the CDF **events** resource type to your Grafana dashboard. To visualize events, you can customize the time range and events to display and rename and organize columns according to your needs.
By default, the `events` annotation query returns events that are active within a time range, but you can customize the query with additional time filters.
**Learn more**: [Visualize events](/cdf/dashboards/guides/grafana/annotations)
#### Templates (Early adopter program)
With Templates, you build **your** view of the data you have available in CDF and simplify the applications and solutions you are working on by accessing data through templates. Templates remove the gap between the application's data model and the preexisting structure of the relevant data. It is easy to scale your solution across more data without changing or redeploying your application code or configuration. Instead, you can work with your template in CDF, and use the tooling available to scale to more data with governance.
#### Charts (Early adopter program)
Use Charts to **explore**, **trend**, and **analyze** industrial data. Find, understand, and troubleshoot for actionable insights from time series and contextualized P\&IDs already in the CDF portal application or other Cognite applications then share the chart for collaboration. Charts runs securely with a single, secure sign-in.
**Learn more**: [Get started with Charts](/cdf/explore/charts)
:::info
To join an Early Adopter program, contact your Cognite representative.
:::
This release of Cognite Data Fusion (CDF) focuses on usability improvements across CDF as well as laying the foundation for existing future features. We are also very proud of our Cognite Power BI Connector, which is now certified by Microsoft.
#### The Cognite Power BI Connector is out of Beta
We're excited to announce that Microsoft has certified the **Cognite Power BI Connector** and that the connector is now **out of Beta**. The Cognite Power BI Connector enables data consumers to easily **read**, **analyze**, and **present** data from Cognite Data Fusion (CDF) in compelling visualizations in Power BI Desktop and the Power BI service.
You can find the connector in the Other category of the Get Data dialog in Power BI. Learn more in our [in-depth article](/cdf/dashboards/guides/powerbi).
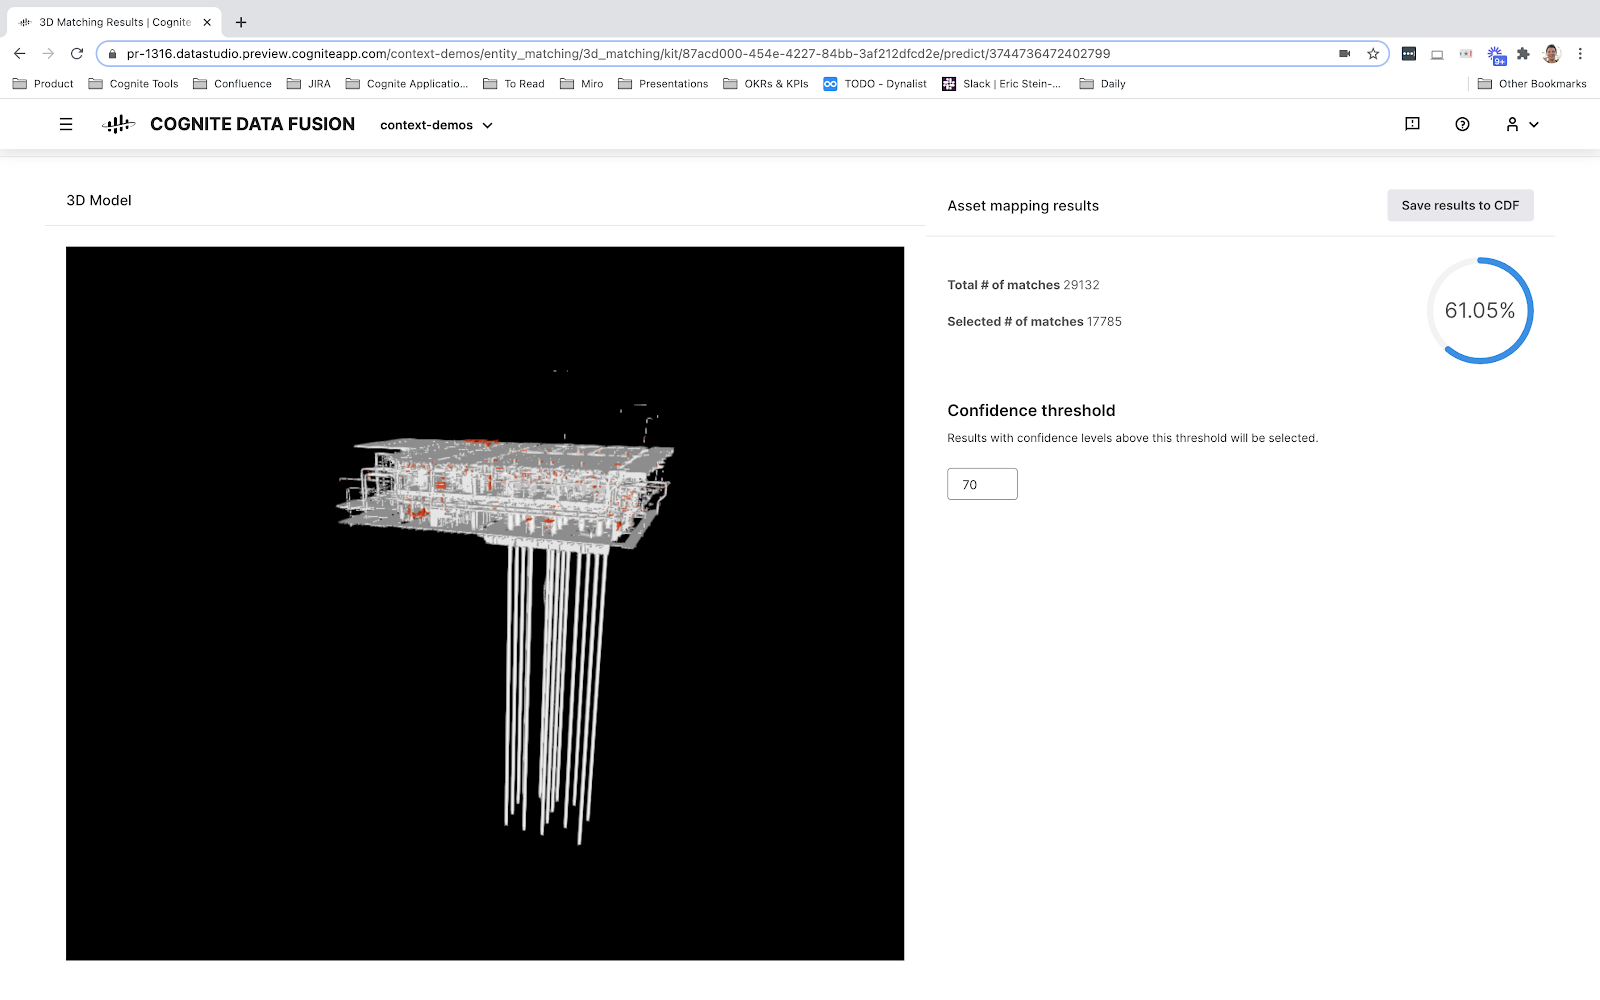
#### Enrich contextualized assets with 3D models
Increase the value outtake of contextualization by **connecting assets to a 3D model** with the new easy-to-use option under **Match entities** in the CDF user interface. Visually inspect assets and zoom into details to get tangible information.
Learn more: [3D contextualization](/cdf/integration/guides/contextualization/matching)
#### Power BI - templates
We have added support for Templates in Power BI to early adopters. Contact your Cognite representative to give it a try and share your feedback!
This release of Cognite Data Fusion (CDF) focuses on the end-to-end data journey with fast and secure authentication to all Cognite applications using your organization's IdP. We currently support Microsoft'sAzure Active Directory (Azure AD). Speed up the time spent getting value for operations using a new sample function for contextualization and add events to a Grafana dashboard for visualizing and analyzing your CDF data.
#### Manage access with OpenID Connect
Register the CDF portal application and other Cognite applications in your IdP (Identity Provider) and use **OpenID Connect** and your **IdP framework** to manage **user** and **service principal** (app) identities securely. We currently support Microsoft's **Azure Active Directory (Azure AD)**.
:::info NOTE
With the introduction of OpenID Connect and the IdP framework to manage CDF access securely, we strongly encourage customers to adopt the new authentication flows as soon as possible.
:::
#### SQL Transformations CLI and Cognite Extractors support OpenID Connect authentication
Transformations CLI users, scheduled transformation jobs, and Cognite extractors can now authenticate using OpenID Connect and Azure AD.
#### Accelerate data set contextualization
Speed up your contextualization with the `entity_matching.suggest.fields` function. Supply the function with data samples to return suggested fields you can use for entity matching in the API, SDK, or UI.
Use existing matches to automatically generate matching rules to apply to all your data.
Add input naming variations to the entity matching model to improve the suggested matches, for example, *pmp* for *pump* and *bhp* for *bottom hole pressure*. To create a list of synonyms, use `replacements` in the API.
#### Visualize, track, and analyze events in Grafana
Boost your insights by adding the CDF **events** resource type to your Grafana dashboard. To visualize events, you can customize the time range and events to display and rename and organize columns according to your needs.
By default, the `events` annotation query returns events that are active within a time range, but you can customize the query with additional time filters.
**Learn more**: [Visualize events](/cdf/dashboards/guides/grafana/annotations)
#### Templates (Early adopter program)
With Templates, you build **your** view of the data you have available in CDF and simplify the applications and solutions you are working on by accessing data through templates. Templates remove the gap between the application's data model and the preexisting structure of the relevant data. It is easy to scale your solution across more data without changing or redeploying your application code or configuration. Instead, you can work with your template in CDF, and use the tooling available to scale to more data with governance.
#### Charts (Early adopter program)
Use Charts to **explore**, **trend**, and **analyze** industrial data. Find, understand, and troubleshoot for actionable insights from time series and contextualized P\&IDs already in the CDF portal application or other Cognite applications then share the chart for collaboration. Charts runs securely with a single, secure sign-in.
**Learn more**: [Get started with Charts](/cdf/explore/charts)
:::info
To join an Early Adopter program, contact your Cognite representative.
:::
This release of Cognite Data Fusion (CDF) focuses on usability improvements across CDF as well as laying the foundation for existing future features. We are also very proud of our Cognite Power BI Connector, which is now certified by Microsoft.
#### The Cognite Power BI Connector is out of Beta
We're excited to announce that Microsoft has certified the **Cognite Power BI Connector** and that the connector is now **out of Beta**. The Cognite Power BI Connector enables data consumers to easily **read**, **analyze**, and **present** data from Cognite Data Fusion (CDF) in compelling visualizations in Power BI Desktop and the Power BI service.
You can find the connector in the Other category of the Get Data dialog in Power BI. Learn more in our [in-depth article](/cdf/dashboards/guides/powerbi).
#### Enrich contextualized assets with 3D models
Increase the value outtake of contextualization by **connecting assets to a 3D model** with the new easy-to-use option under **Match entities** in the CDF user interface. Visually inspect assets and zoom into details to get tangible information.
Learn more: [3D contextualization](/cdf/integration/guides/contextualization/matching)
 #### Accelerate finding and filtering relevant data
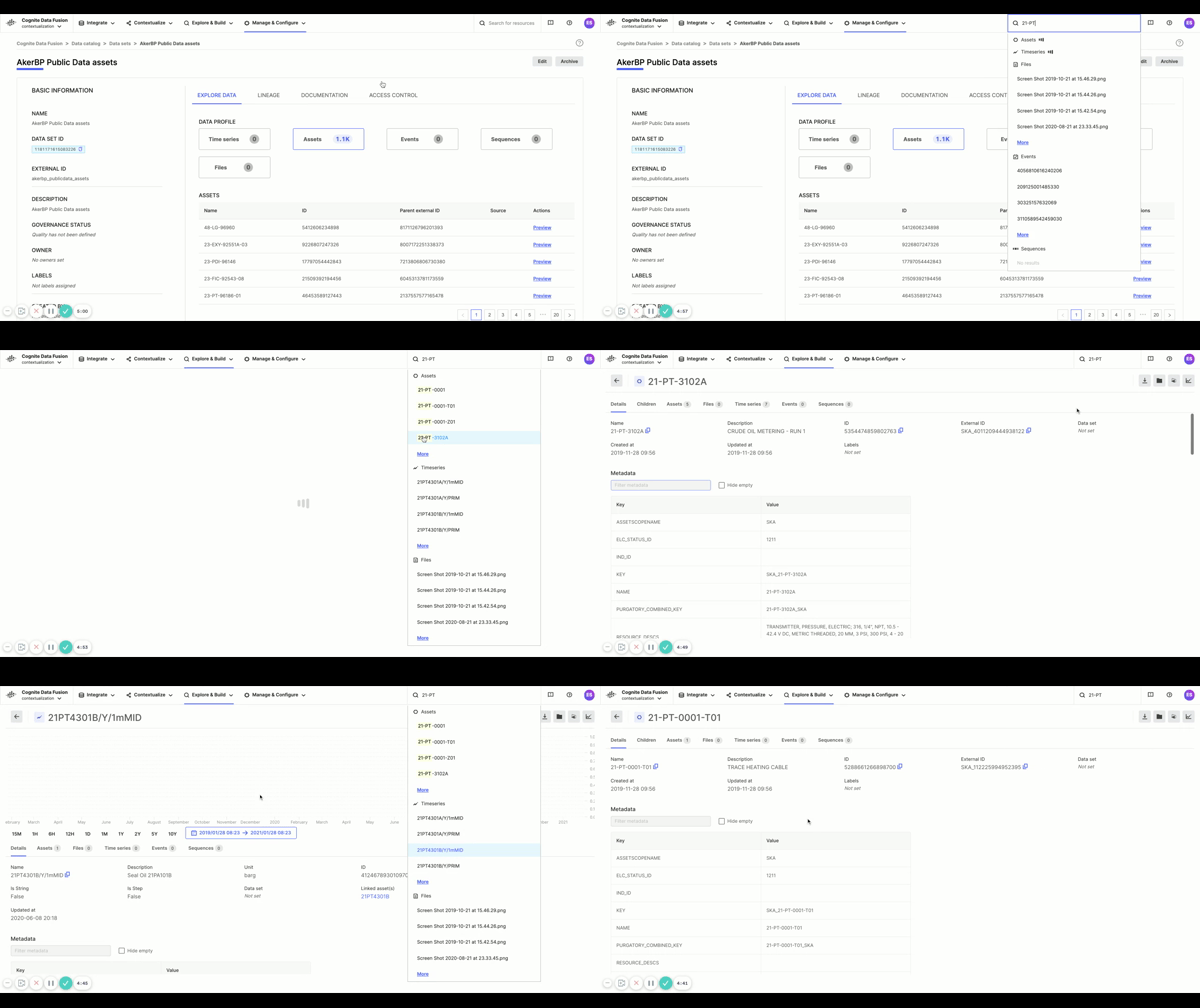
Finding the data you need is now even easier in the **CDF Data explorer**. Navigate between different parts of CDF with the new **drop-down navigation in the top bar** and shift between multiple CDF resources with **more descriptive tab names**.
#### Accelerate finding and filtering relevant data
Finding the data you need is now even easier in the **CDF Data explorer**. Navigate between different parts of CDF with the new **drop-down navigation in the top bar** and shift between multiple CDF resources with **more descriptive tab names**.
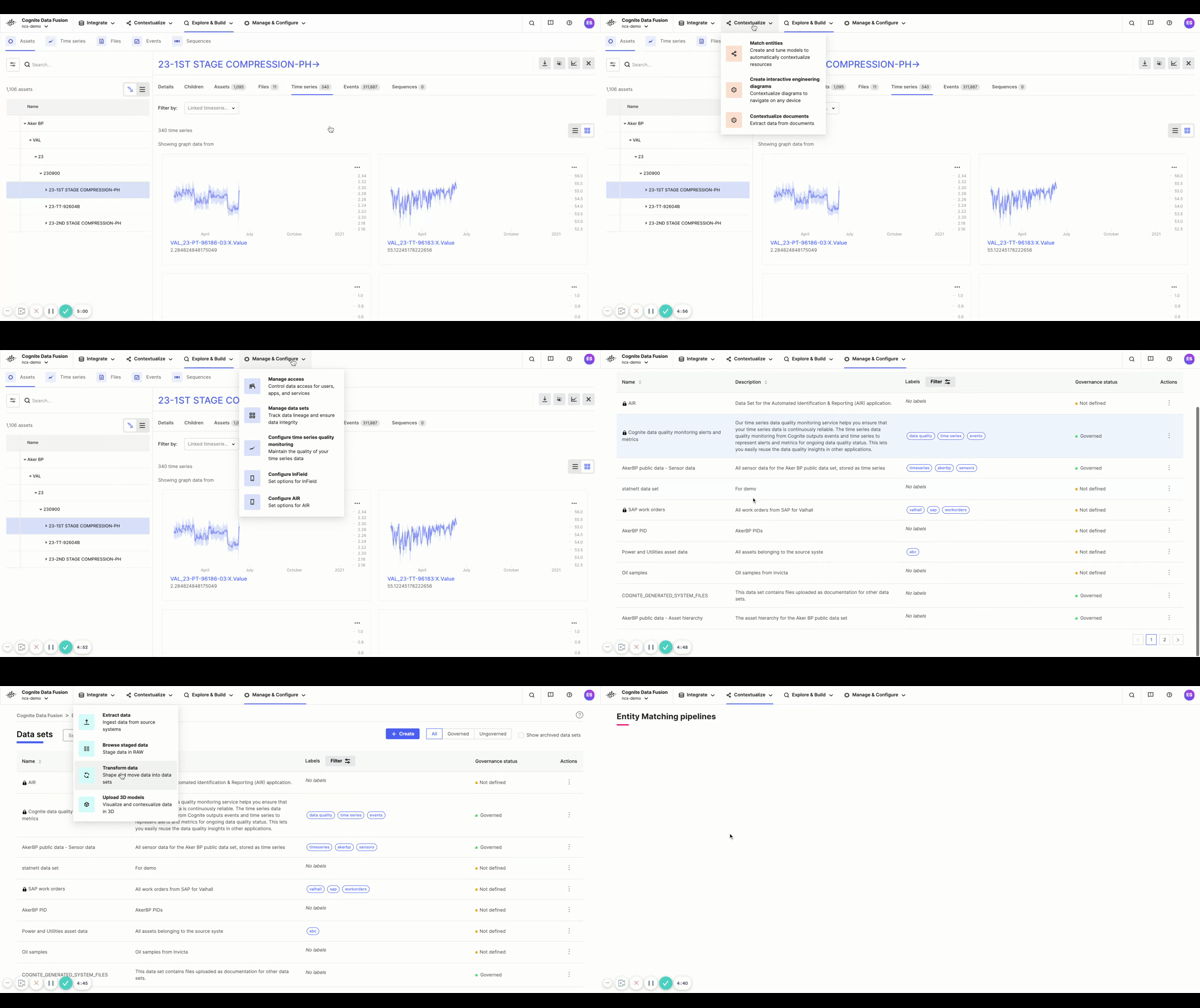 Use the new **Quick search** in the top navigation to search for the resource names and explore data from anywhere in CDF. Filter on metadata and **hide the empty fields for any resource** and **show aggregated values of metadata keys for assets** to get unique values ordered by frequency (if enabled in the API). You'll also notice that **date points are added to the time series sparkline** to better visualize missing data for a given range.
 Learn more: [Data explorer](/cdf/integration/guides/exploration/data_explorer)
#### Labels and relationships in SQL transformations
Create and delete data related to the `Relationships` and `Labels` resource types when you use SQL queries in **CDF Transformations** to transform data from the CDF staging area into the CDF data model.
Learn more: [CDF Transformations](/cdf/integration/guides/transformation/transformations)
#### Enhanced results page for entity matching pipelines
**Get more information about the results, rules, and rule conflicts** for matches from your **Entity matching pipelines** in CDF and improve rule predictions by selecting particular matches to CDF.
Learn more: [Entity matching](/cdf/integration/guides/contextualization/matching)
This release focuses on improving **access** and **discoverability** of data and **workflow automation**. Cut down on time you spend trying to find data, make sense of it, and then deploy and monitor it. We deliver tools to speed up this process and allow you, the user, to compound the value of your work. Improved performance and capabilities for your digital teams means a faster time to value for operations.
#### Explore and discover the right data for your solutions
Use the CDF Data Explorer to **find**, **validate**, and **learn** about the data you need to build solutions. Browse through all the available resource types in your CDF project and drill into details and linked resources, for example, assets and time series with live data, interactive P\&IDs, and mapped events.
Learn more: [CDF Data Explorer](/cdf/integration/guides/exploration/data_explorer)
#### Configure and rerun contextualization pipelines
Create a pipeline to re-run matching models on data sets. If the data set receives new data, you can re-run the pipeline to find additional matches.
Learn more: [Entity matching](/cdf/integration/guides/contextualization/matching)
#### Enrich files with geographic location
The new `geoLocation` field for the Files resource type lets you contextualize and find documents or files related to geographic locations. For example, find seismic reports for an area or drone survey photos from a yard section.
Learn more: [Geographic location of files](/api-reference/concepts/20230101/files#geographic-location-of-files)
#### Monitor your SQL transformations
Subscribe to email notifications to [monitor the transformation process](/cdf/integration/guides/transformation/transformations#monitor-scheduled-transformations) and solve any issues before they reach the data consumer. You can add up to 5 email addresses, either to groups or to specific people.
#### Flexible data modeling with relationships
This release sees the [relationships](/api-reference/concepts/20230101/relationships) resource type moving from Beta to [API v1](/api-reference/concepts/20230101/api-description).
While you can use the assets resource type to model equipment relations as a **tree**, relationships let you model data in additional **graph** structures meaningful for your organization.
Data engineers can use relationships to organize assets into multiple structures. For example, you can order assets by the *process flow* or the physical connectivity in a grid structure to let users efficiently locate data for nearby equipment.
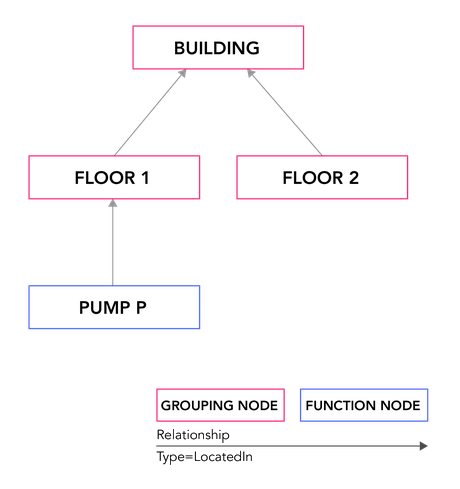
Some users in your organization may find it useful and efficient to organize the equipment by its function in a *maintenance hierarchy*. Others may benefit from having the equipment organized by physical location in a *location-based* hierarchy:
Learn more: [Data explorer](/cdf/integration/guides/exploration/data_explorer)
#### Labels and relationships in SQL transformations
Create and delete data related to the `Relationships` and `Labels` resource types when you use SQL queries in **CDF Transformations** to transform data from the CDF staging area into the CDF data model.
Learn more: [CDF Transformations](/cdf/integration/guides/transformation/transformations)
#### Enhanced results page for entity matching pipelines
**Get more information about the results, rules, and rule conflicts** for matches from your **Entity matching pipelines** in CDF and improve rule predictions by selecting particular matches to CDF.
Learn more: [Entity matching](/cdf/integration/guides/contextualization/matching)
This release focuses on improving **access** and **discoverability** of data and **workflow automation**. Cut down on time you spend trying to find data, make sense of it, and then deploy and monitor it. We deliver tools to speed up this process and allow you, the user, to compound the value of your work. Improved performance and capabilities for your digital teams means a faster time to value for operations.
#### Explore and discover the right data for your solutions
Use the CDF Data Explorer to **find**, **validate**, and **learn** about the data you need to build solutions. Browse through all the available resource types in your CDF project and drill into details and linked resources, for example, assets and time series with live data, interactive P\&IDs, and mapped events.
Learn more: [CDF Data Explorer](/cdf/integration/guides/exploration/data_explorer)
#### Configure and rerun contextualization pipelines
Create a pipeline to re-run matching models on data sets. If the data set receives new data, you can re-run the pipeline to find additional matches.
Learn more: [Entity matching](/cdf/integration/guides/contextualization/matching)
#### Enrich files with geographic location
The new `geoLocation` field for the Files resource type lets you contextualize and find documents or files related to geographic locations. For example, find seismic reports for an area or drone survey photos from a yard section.
Learn more: [Geographic location of files](/api-reference/concepts/20230101/files#geographic-location-of-files)
#### Monitor your SQL transformations
Subscribe to email notifications to [monitor the transformation process](/cdf/integration/guides/transformation/transformations#monitor-scheduled-transformations) and solve any issues before they reach the data consumer. You can add up to 5 email addresses, either to groups or to specific people.
#### Flexible data modeling with relationships
This release sees the [relationships](/api-reference/concepts/20230101/relationships) resource type moving from Beta to [API v1](/api-reference/concepts/20230101/api-description).
While you can use the assets resource type to model equipment relations as a **tree**, relationships let you model data in additional **graph** structures meaningful for your organization.
Data engineers can use relationships to organize assets into multiple structures. For example, you can order assets by the *process flow* or the physical connectivity in a grid structure to let users efficiently locate data for nearby equipment.
Some users in your organization may find it useful and efficient to organize the equipment by its function in a *maintenance hierarchy*. Others may benefit from having the equipment organized by physical location in a *location-based* hierarchy:
 Beyond structuring assets, you can use relationships to create richer connections between data elements and build a knowledge graph on top of the existing data.
To learn more about how relationships can represent industrial reality, we recommend reading the ["Building a contextualized power system network model"](https://f.hubspotusercontent10.net/hubfs/6407318/Building%20a%20Contextualized%20Power%20System%20Network%20Model.pdf) whitepaper.
## Other releases
* [Current updates](/cdf/whatsnew)
* [2024 updates](/cdf/whatsnew/2024)
* [2023 updates](/cdf/whatsnew/2023)
* [2022 updates](/cdf/whatsnew/2022)
Beyond structuring assets, you can use relationships to create richer connections between data elements and build a knowledge graph on top of the existing data.
To learn more about how relationships can represent industrial reality, we recommend reading the ["Building a contextualized power system network model"](https://f.hubspotusercontent10.net/hubfs/6407318/Building%20a%20Contextualized%20Power%20System%20Network%20Model.pdf) whitepaper.
## Other releases
* [Current updates](/cdf/whatsnew)
* [2024 updates](/cdf/whatsnew/2024)
* [2023 updates](/cdf/whatsnew/2023)
* [2022 updates](/cdf/whatsnew/2022)