> ## Documentation Index
> Fetch the complete documentation index at: https://docs.cognite.com/llms.txt
> Use this file to discover all available pages before exploring further.
# Plot time series from data model views
> Create dashboards and select the time series you want to plot using custom queries, filtering, aggregation, and advanced features.
Data modeling projects can reference time series using `instanceId` (an object with `space` and `externalId`) in addition to the traditional `id` or `externalId` methods.
## Create a dashboard
To create a dashboard with time series data from Cognite Data Fusion (CDF):
Sign in to your Grafana instance and create a dashboard.
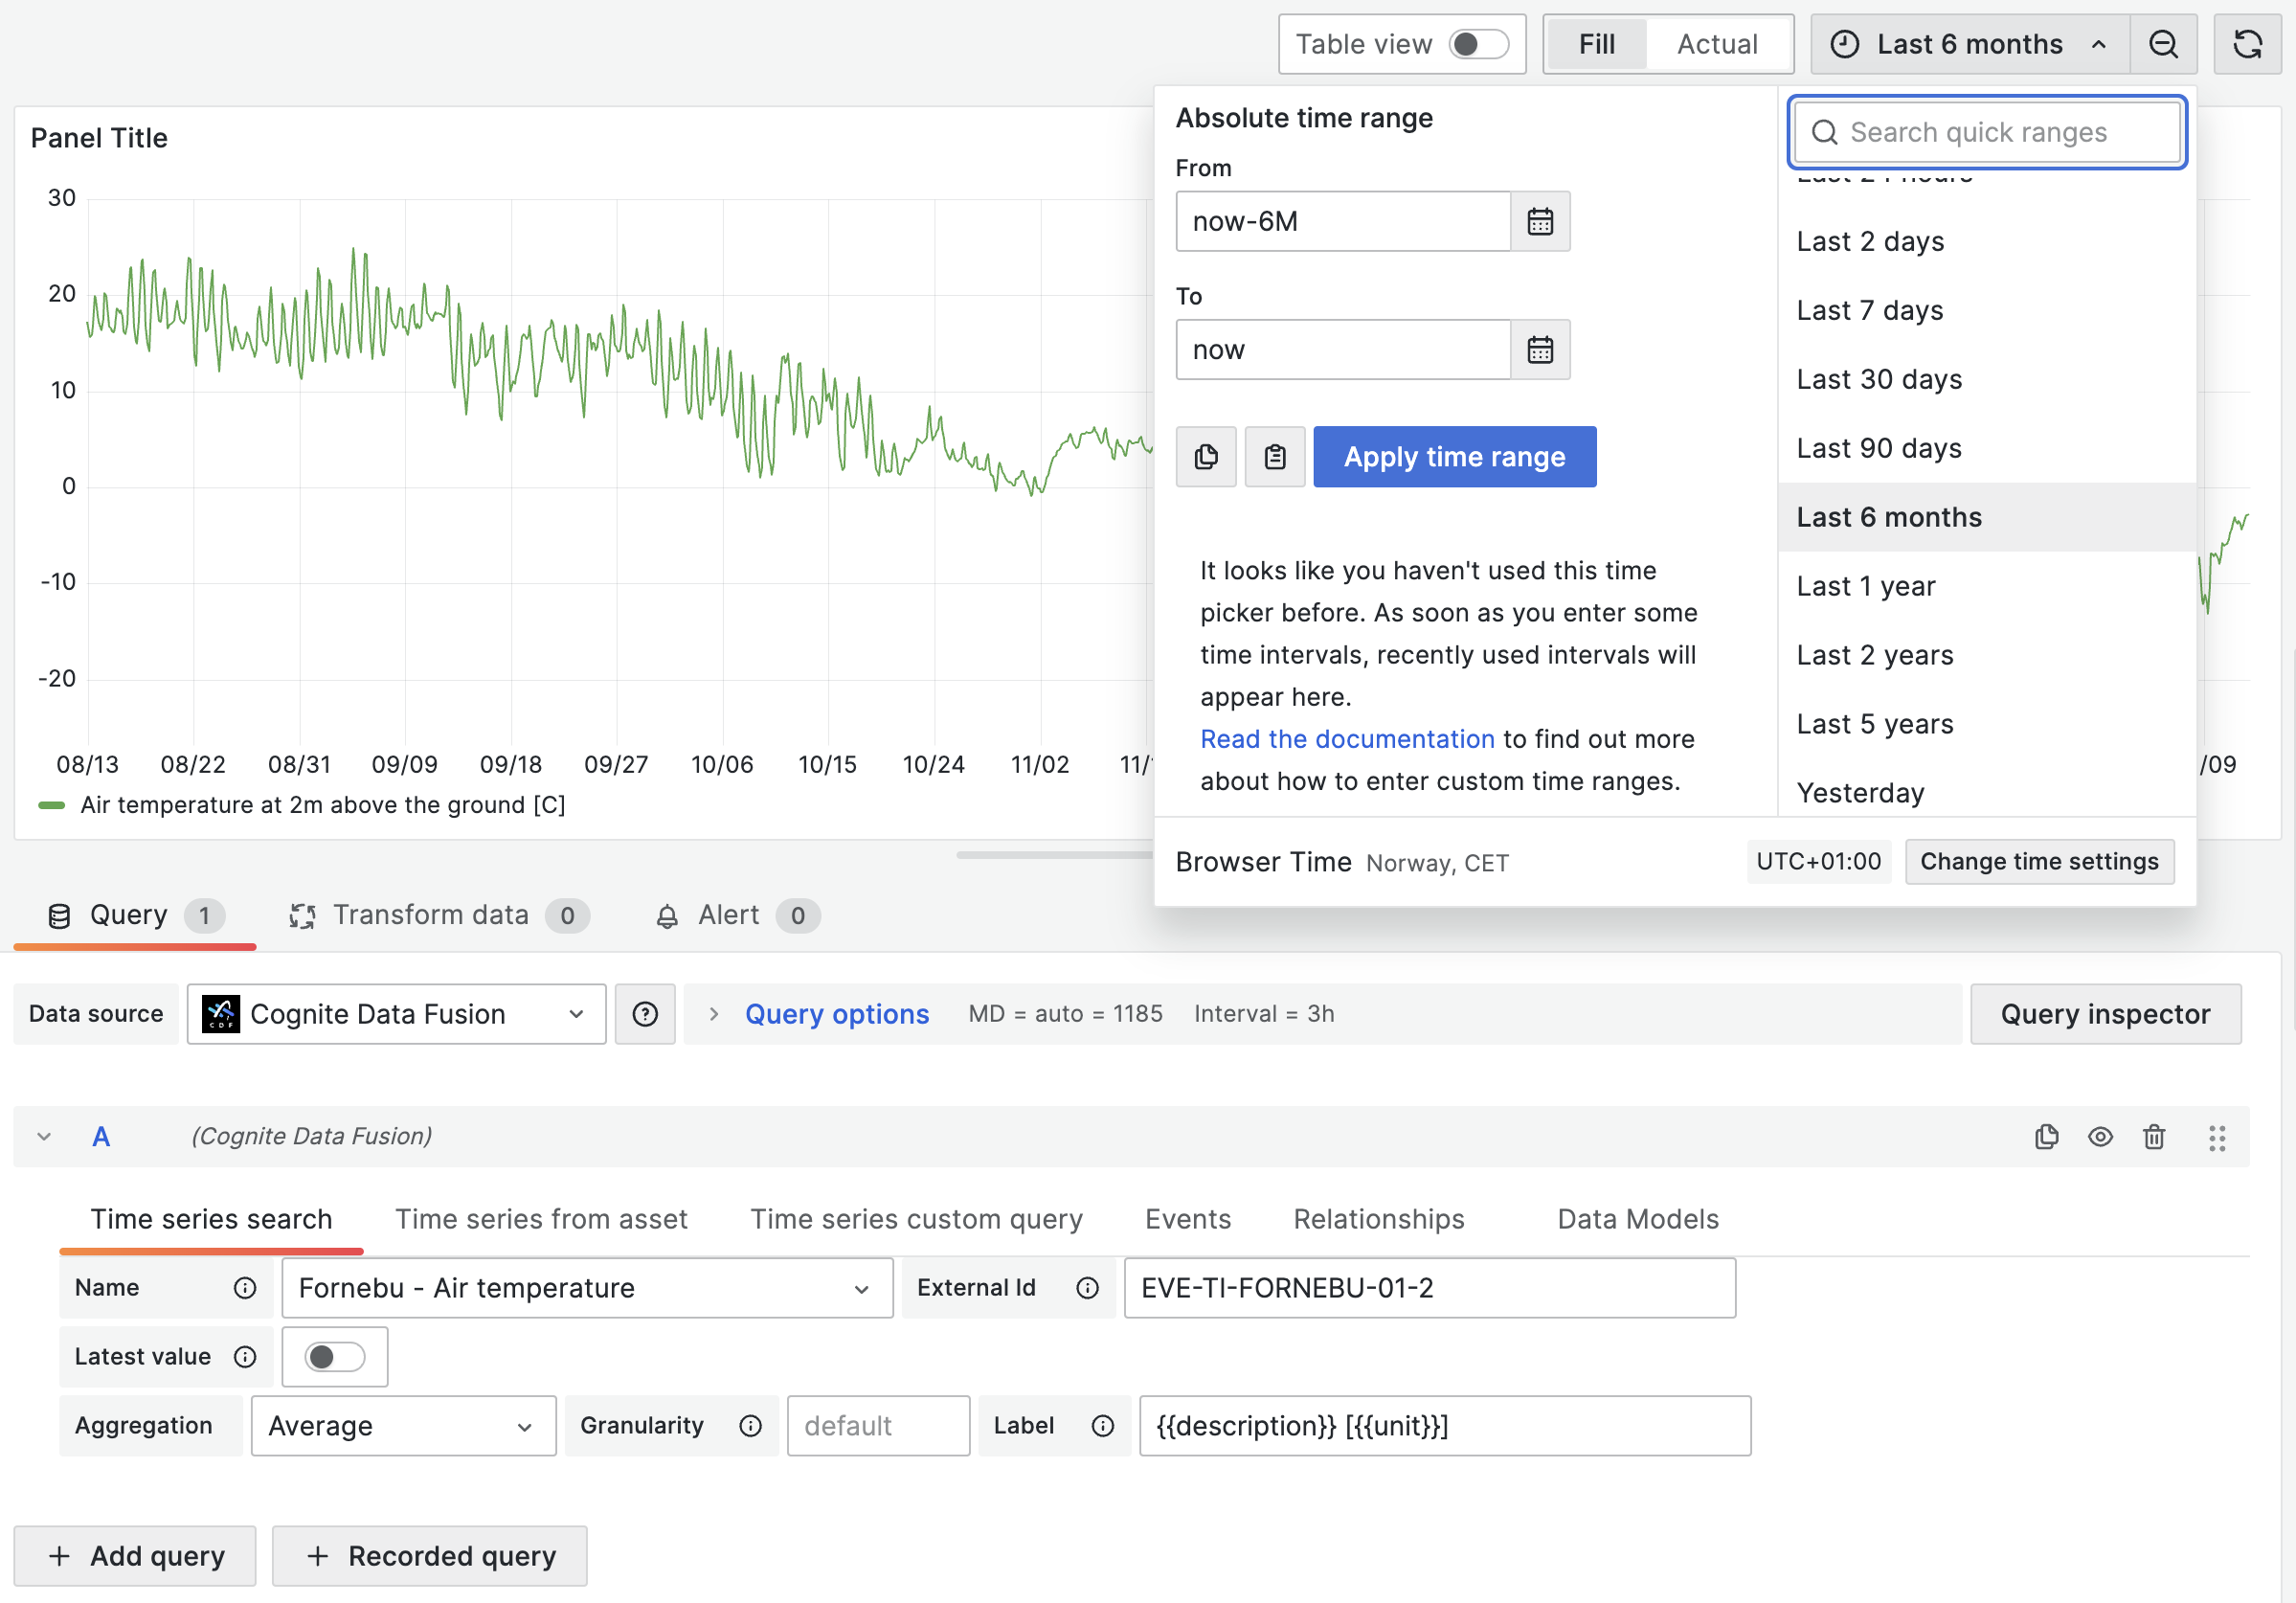
Use the query tabs below the main chart area to select time series for your dashboard.
If your query tabs are missing, check the feature flags in the data source settings.
* **CogniteTimeSeries** - search for time series from data model views. Select a **View** and start typing to filter and select a time series.
Optionally, set a custom **label** and use the format `{{property}}` to pull data from the time series. You can use all the available [time series properties](/api-reference/concepts/20230101/time-series) to define a label, for example, `{{name}} - {{description}}` or `{{metadata.key1}}`.
Use this tab when your time series are defined in data models. The **View** dropdown lists views that implement the `CogniteTimeSeries` container and shows the view name, space, and version. After you select a view, search by name or description to find time series instances. This tab filters out string time series, and selections use the instance ID (space and external ID).
If a time series has a unit, you can select a target unit in the query. The target unit dropdown appears only when a unit is defined, shows compatible units in the same quantity, and displays the current unit for reference.
* **Data models** - run a GraphQL query to fetch instances from a data model and plot their time series. See [Display time series from the Data models tab](#display-time-series-data-from-data-model-instances) below.
The time series matching your selection will be rendered in the chart area. Adjust the timeframe as necessary to display relevant data.
 ## Display time series data from data model instances
You can display time series data from instances of CDF data models using the **Data models** tab:
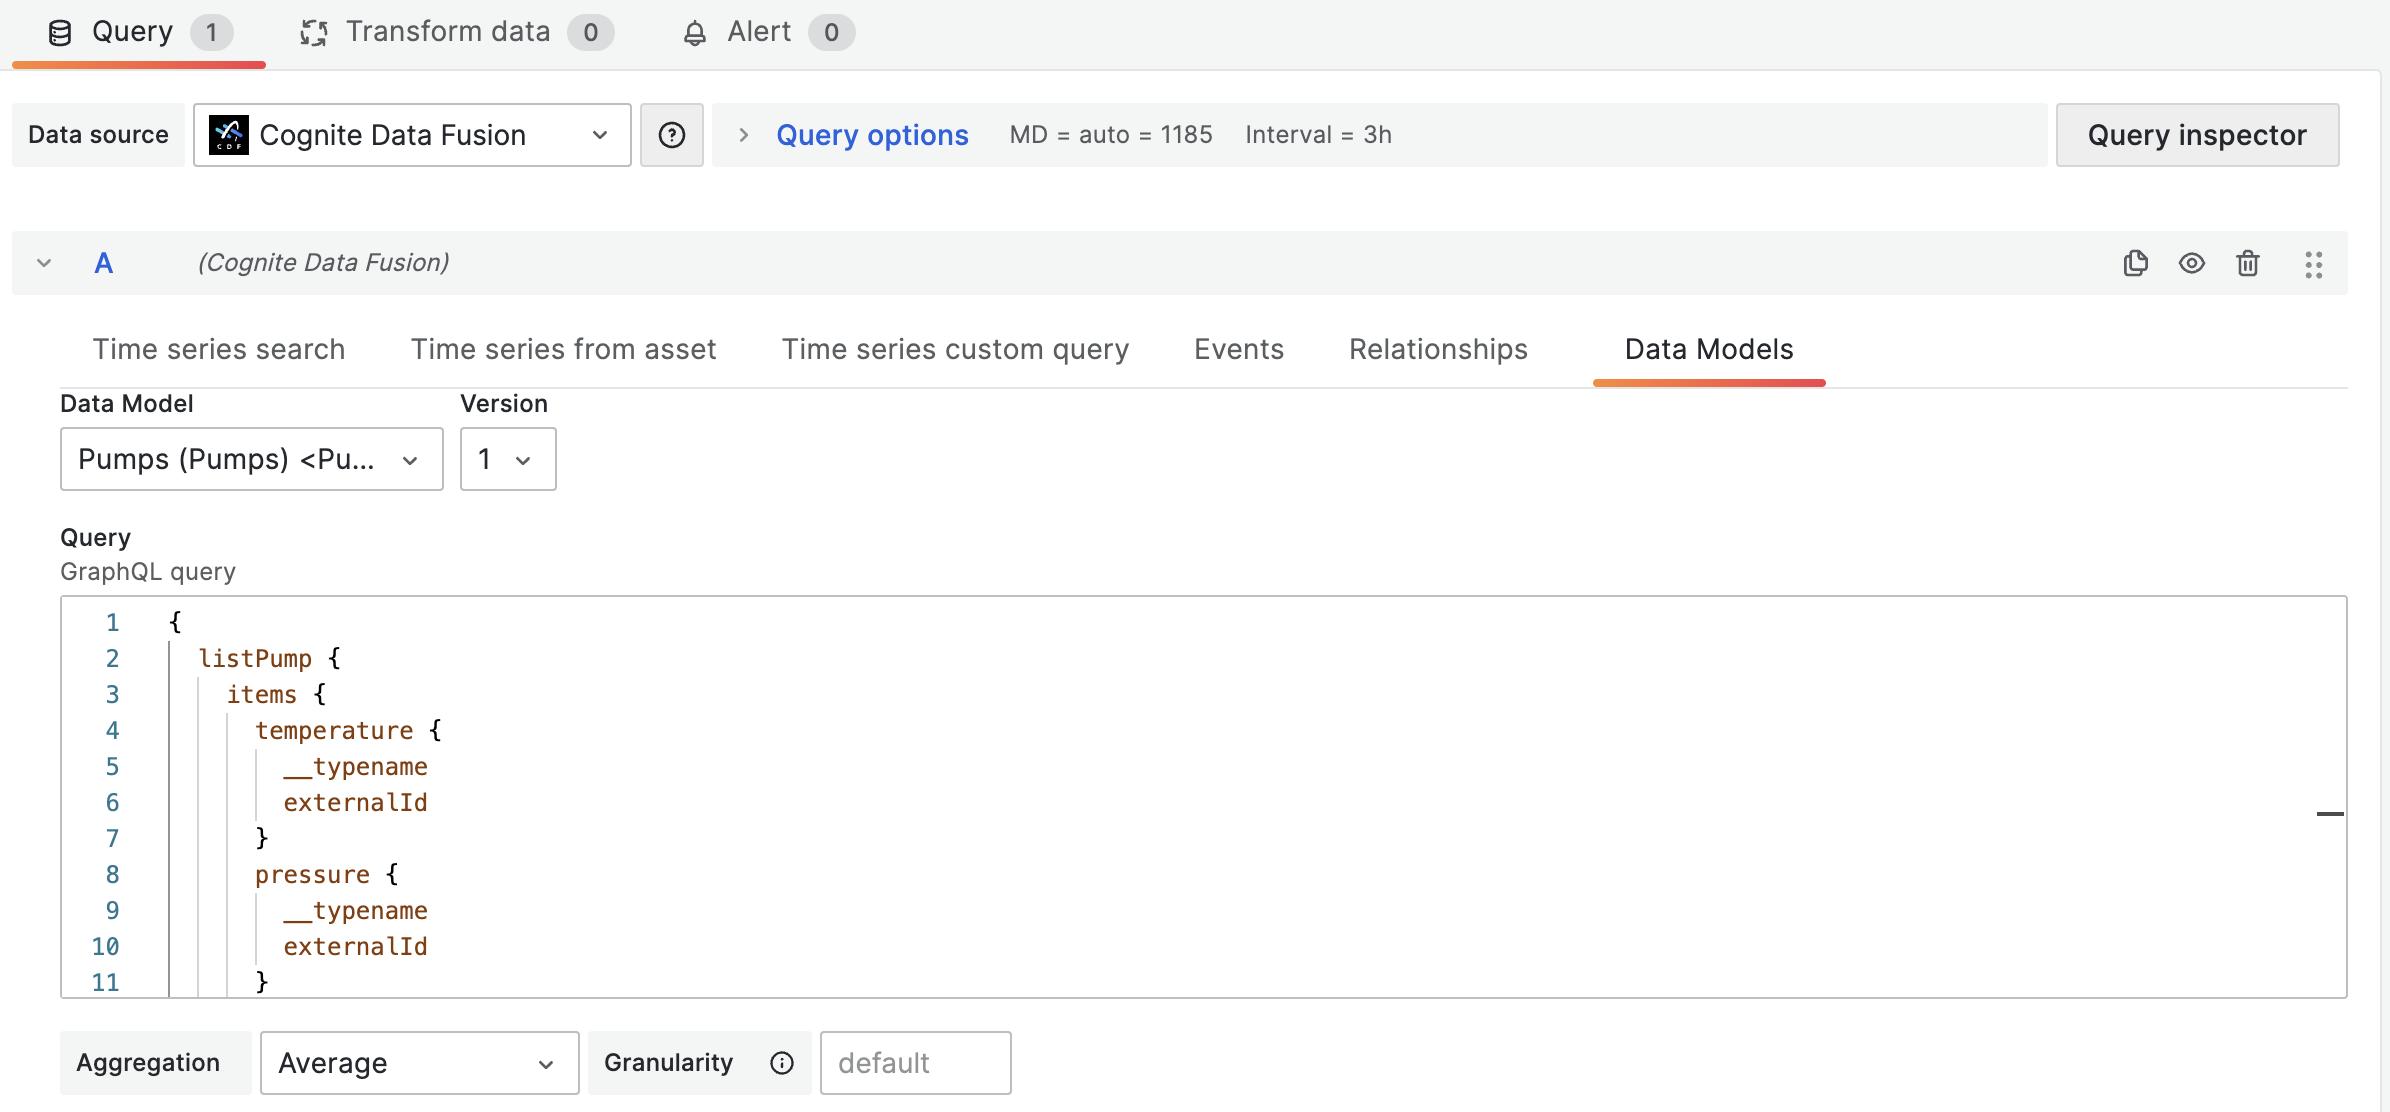
On the Data models tab, select the data model and version.
Add `__typename` and `externalId` below the fields that contain the time series. In this example, below `temperature` and `pressure`:
```graphql theme={"languages":{"custom":["/_languages/kuiper.json","../_languages/kuiper.json"]}}
{
listPump {
items {
temperature {
__typename
externalId
}
pressure {
__typename
externalId
}
}
}
}
```
Grafana automatically detects time series in your query results. If your query returns fields with `type: "numeric"` that include `space` and `externalId`, Grafana treats them as time series and fetches data points automatically. Keep `__typename` and `externalId` in the query to support older detection behavior and queries that return mixed instance types.
## Display time series data from data model instances
You can display time series data from instances of CDF data models using the **Data models** tab:
On the Data models tab, select the data model and version.
Add `__typename` and `externalId` below the fields that contain the time series. In this example, below `temperature` and `pressure`:
```graphql theme={"languages":{"custom":["/_languages/kuiper.json","../_languages/kuiper.json"]}}
{
listPump {
items {
temperature {
__typename
externalId
}
pressure {
__typename
externalId
}
}
}
}
```
Grafana automatically detects time series in your query results. If your query returns fields with `type: "numeric"` that include `space` and `externalId`, Grafana treats them as time series and fetches data points automatically. Keep `__typename` and `externalId` in the query to support older detection behavior and queries that return mixed instance types.