Visualize events
Set up and filter queries on CDF events and annotate the events to graphs on your Grafana dashboard. You can customize the time range, the events to display, and the columns according to your needs.
Work with events in a table
Open the Event tab in Grafana to work with the events in a table.
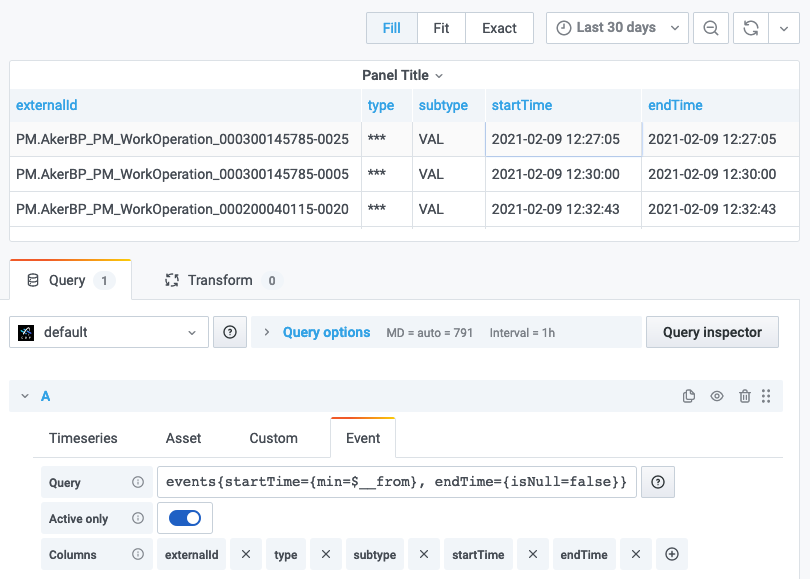
Define a query
The events query uses the events/list endpoint to retrieve data.
Format: events{someFilter=number, otherFilter="string"}
Example:
events{externalIdPrefix='WORKORDER', assetSubtreeIds=[{id=12}, {externalId='ext_id'}]}
You can filter on these properties:
externalIdPrefix, metadata, assetIds, assetExternalIds, rootAssetIds, assetSubtreeIds, dataSetIds, source, type, and subtype.
By default, the query returns active events in the time range, but you can customize a query with the additional time filters startTime, endTime, activeAtTime, createdTime, and lastUpdatedTime.
This example returns all finished events that started in the current time range:
events{startTime={min=$__from}, endTime={isNull=false}}
This example returns only finished events:
events{endTime={isNull=false}}
Client-side filtering
Specify more client-side filtering with the =~, !~, and != operators. A comma between several filters acts as a logical AND.
Format:
-
=~- regex equality. Returns results satisfying the regular expression. -
!~- regex inequality. Excludes results satisfying the regular expression. -
!=- strict inequality. Returns items where a property doesn't equal a given value.
Example:
events{type='WORKORDER', subtype=~'SUB.*'}
Don't use the client-side filters as the primary filtering method.
Grafana applies the filters after items have been returned from CDF, and you may not see all data if CDF returns the maximum number of items (1000).
Create templates
Create templates by using the $variable_name syntax.
Example:
events{type='WORKORDER', subtype=$variable}
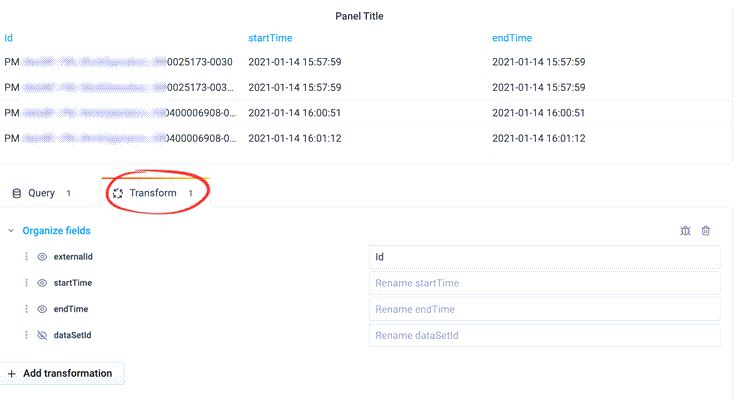
Rename and organize fields
Select the Transform tab to rename and organize fields.
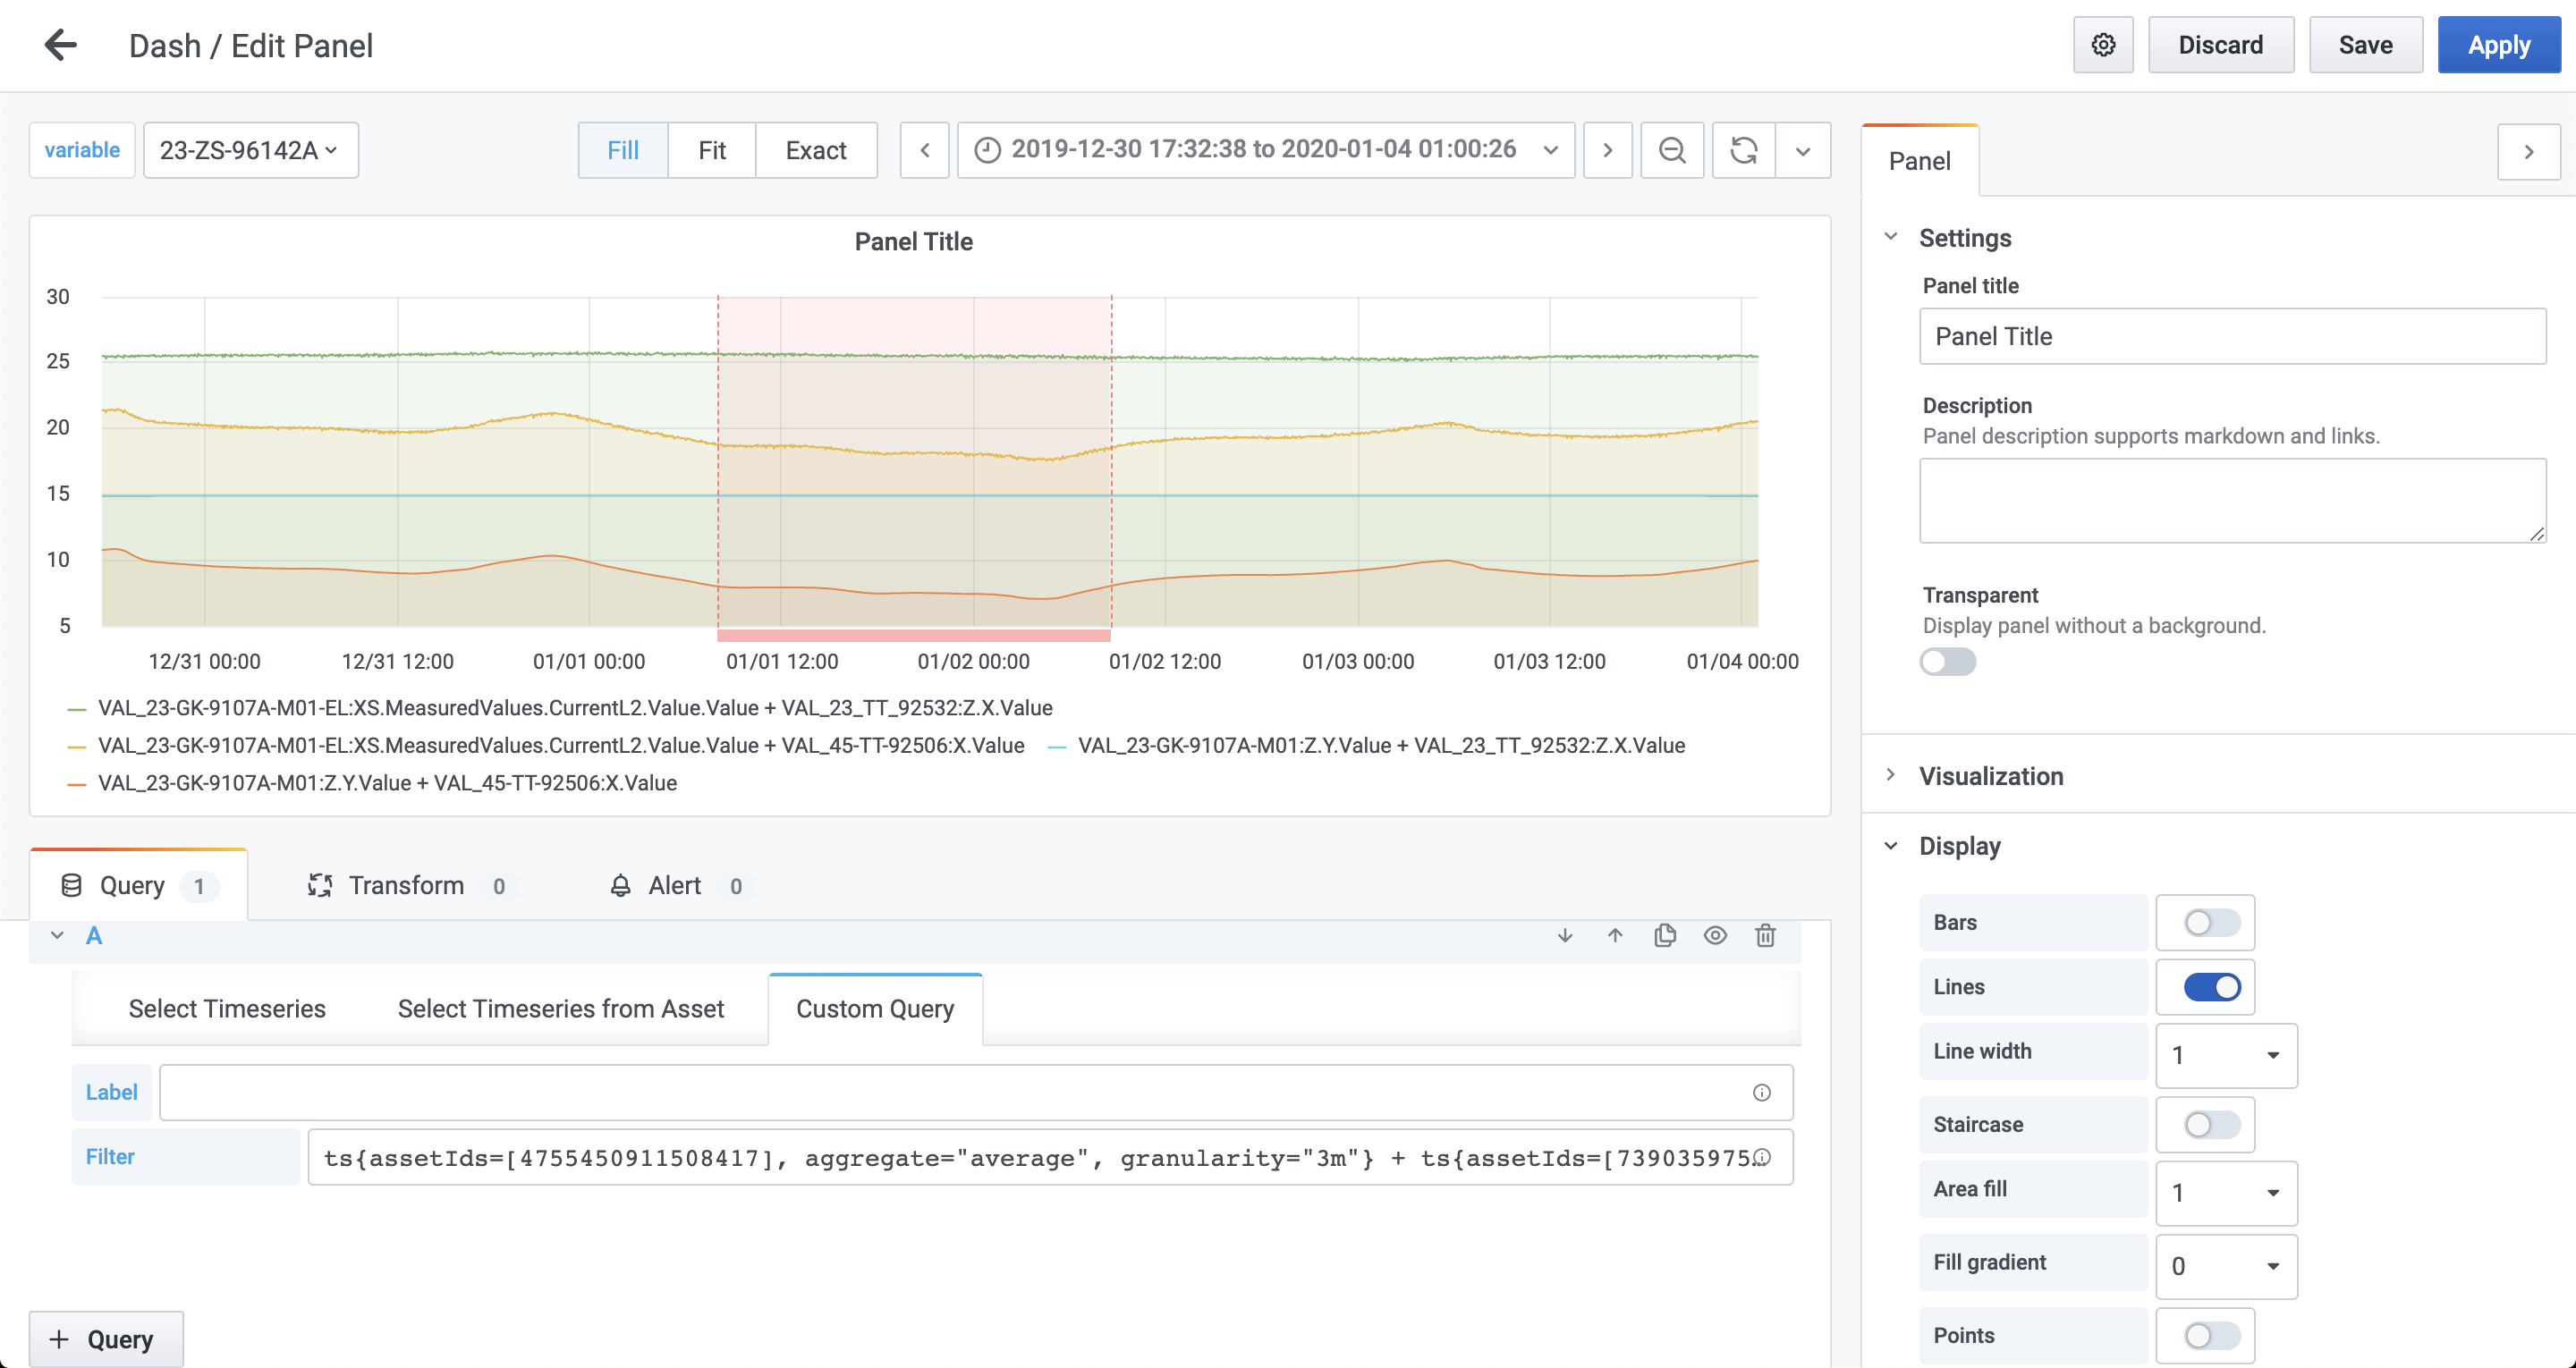
Annotate graphs with events
Use annotations to overlay rich event information from CDF on graphs in Grafana.
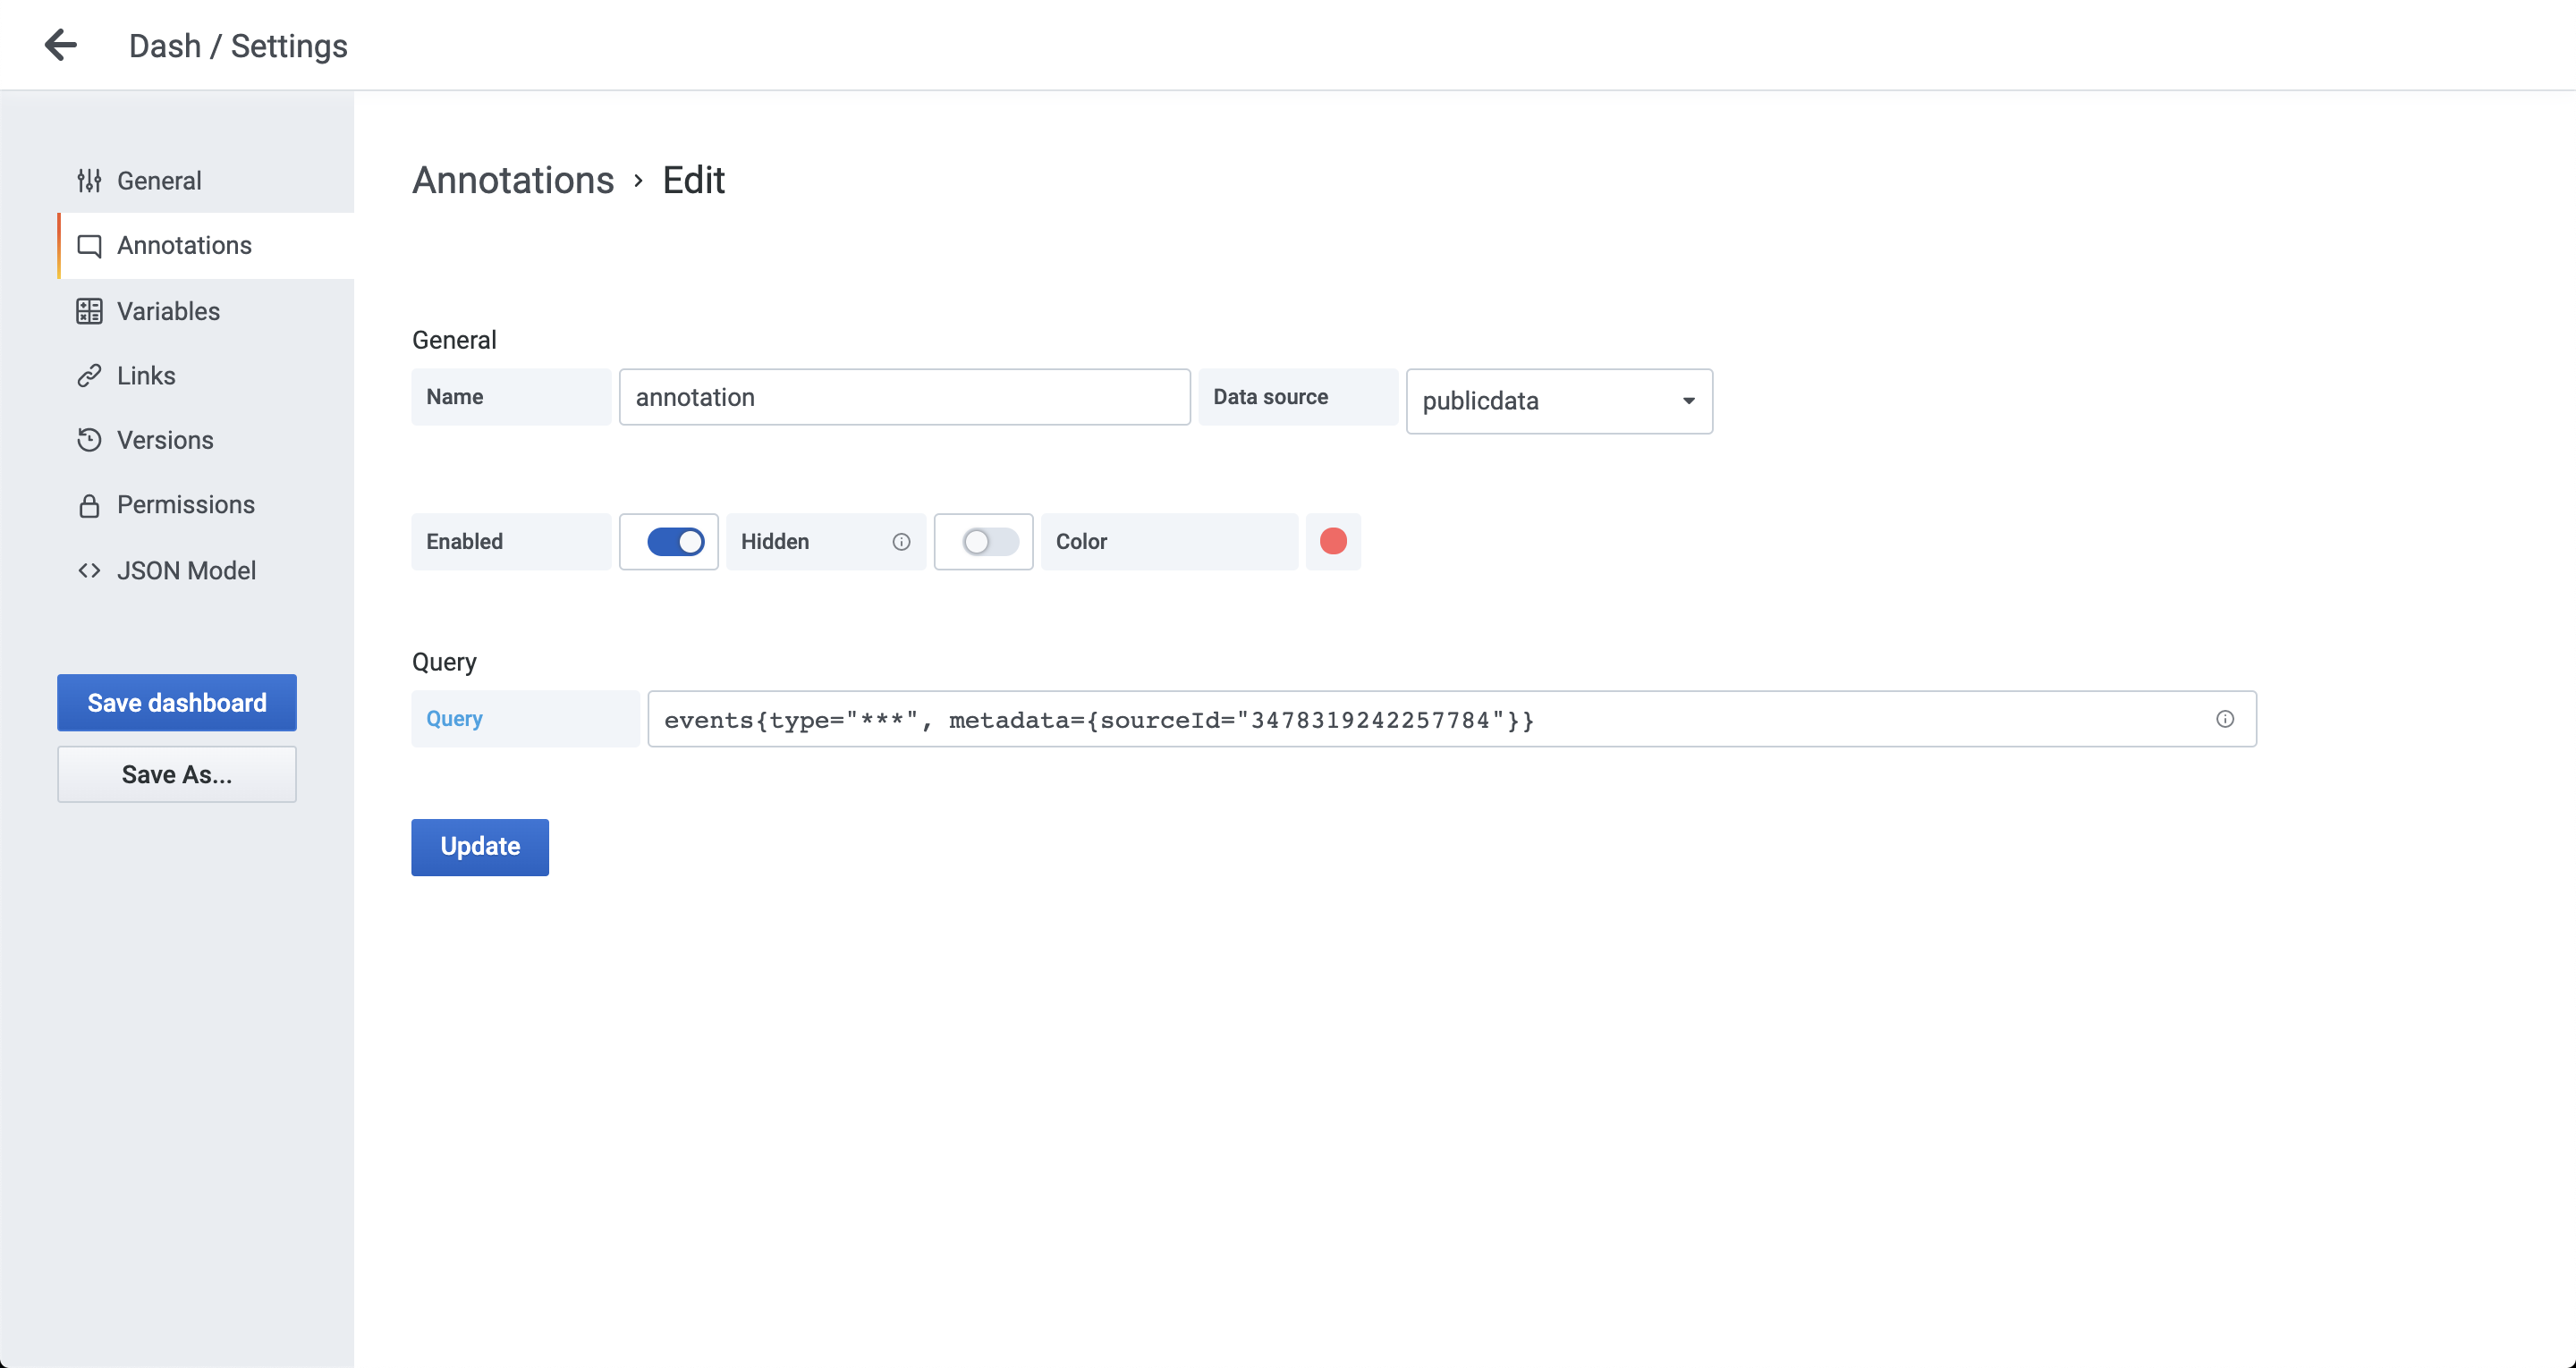
- Navigate to your dashboard's settings, and select Annotations.
- Select your
CDFproject in the Data Source field.
-
Specify the query to fetch and filter events from
CDF. For example:events{type="some", subtype=~"sub.*"}The query above requests events with parameter
type="some"and filters the results bysubtypethat matchessub.*.-
For a complete list of valid parameters, see the API documentation.
-
Learn how to filter the results.
-